Introduction
The cerebral cortex of mammals primarily consists of a set of brain areas organized as topographic maps (Kaas et al. 1997, Vanessen et al. 2001). These maps contain systematic two-dimensional representations of features relevant to sensory, motor, and/or associative processing, such as retinal position, sound frequency, line orientation, or sensory or motor motion direction (Blasdel 1992, Merzenich et al. 1975, Weliky et al. 1996). Understanding the development and function of topographic maps is crucial for understanding brain function, and will require integrating large-scale experimental imaging results with single-unit studies of individual neurons and their connections.
Computational simulations have proven to be a powerful tool in this endeavor. In a simulation, it is possible to explore how topographic maps can emerge from the behavior of single neurons, both during development and during perceptual and motor processing in the adult. (For a review of this class of models, see Swindale et al. 1996.) However, the models to date have been limited in size and scope because existing simulation tools do not provide specific support for biologically realistic, densely interconnected topographic maps. Existing biological neural simulators, such as Neuron (Hines et al. 1997) and GENESIS (Bower et al. 1998), primarily focus on detailed studies of individual neurons or very small networks of them. Tools for simulating large populations of abstract units, such as PDP++ (O’Reilly et al, 2000) and Matlab focus primarily on engineering or cognitive science rather than neurobiological applications. Other simulators also lack specific support for measuring topographic map structure or generating input patterns at the topographic map level.
The Topographica map-level simulator is designed to make it practical to simulate large-scale, detailed models of topographic maps. Topographica complements the existing low-level and abstract simulators, focusing on biologically realistic networks of tens or hundreds of thousands of neurons, forming topographic maps containing tens or hundreds of millions of connections. The goals of models at this level include understanding how topographic maps develop, how much of this development is driven by the environment, what computations the adult maps perform, how high-level capabilities are implemented by these maps, and how to relate large-scale phenomena to the activity of single units in maps. The overall goal is generally to understand the brain at a scale that is directly relevant to behavior.
Topographica was developed through a collaboration between the University of Texas at Austin and the University of Edinburgh, funded by the Human Brain Project of the National Institutes of Mental Health. Now that the simulator has been released, it is a fully open source project managed by James A. Bednar, who coordinates contributions from all users. Binaries and source code are all freely available through the internet at topographica.org, and volunteers are encouraged to join as Topographica users and developers.
In the sections below, we describe the models and modeling approaches supported by Topographica, how the simulator is designed, and how it can be used to advance the field of computational neuroscience.
Scope and modeling approach
Topographica is designed to simulate topographic maps in any two-dimensional cortical or subcortical region, such as visual, auditory, somatosensory, proprioceptive, and motor maps, plus the relevant parts of the external environment. Typically, models will include multiple brain regions, such as a part of an auditory or visual processing pathway, and simulate a large enough area to allow the organization and function of each map to be studied.
To make it practical to model topographic maps at this large scale, the fundamental neural unit in the simulator is a two-dimensional sheet of neurons, rather than a neuron or a part of a neuron. Conceptually, a sheet is a continuous, two-dimensional area (as in Amari, Roque da Silva Filho et al. 1992), which is typically approximated by a finite array of individual neurons. Topographica models consist of an interconnected set of such sheets, where each brain region is represented by one or more sheets.
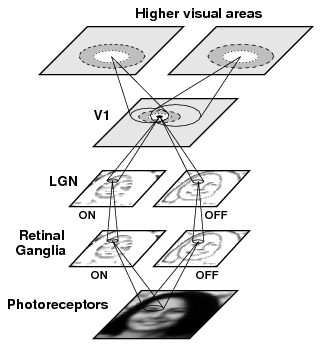
Sample Topographica model of the visual system
The figure at right shows a sample Topographica model of the early visual system (Bednar et al. 2003, Bednar et al. 2004). In this model, the eye is represented by three sheets: a sheet representing an array of photoreceptors, plus two sheets representing different types of retinal ganglion cells. The lateral geniculate nucleus of the thalamus is represented by two sheets, and three cortical areas are represented by one sheet each. Each of these sheets can be coarse or detailed, plastic or fixed, and simple or complex, as needed for a particular study.
Sheets can be connected to other sheets in any combination, including lateral connections from the same sheet to itself, and recurrent feedback between sheets. Sheet-to-sheet connections are called projections; these typically consist of a large set of individual connections between units in each sheet. For one unit in each sheet in the figure, example connections are shown for each projection, including lateral projections in V1 and higher areas. Each circular patch of connections is called a connection field, consisting of input connections from a spatially restricted region of a sheet.
Similar models can be used for topographic maps in somatosensory, auditory, and motor cortex. Current biologically realistic models include only a small number of sheets starting with a sensory area, but Topographica is designed to make larger, more complex models possible to simulate and to understand. Explicitly formulating models at the sheet level is crucial to the simulator design, because it allows user parameters, model specifications, and interfaces to be independent of the details of how each sheet is implemented.
As a result, the user can easily trade off between simulation detail and computational requirements, depending on the specific phenomena under study in a given simulator run. (See Bednar et al. 2004 for more details on model scaling.) If enough computational power and experimental measurements are available, models can be simulated at full scale, with as many neurons and connections as in the animal system being studied. More typically, a less-dense approximation will be used, requiring only ordinary PC workstations. Because the same model specifications and parameters can be used in each case, switching between levels of analysis does not require extensive parameter tuning or debugging, as would be required in neuron-level or engineering-oriented simulators.
For most simulations, the individual neuron models within sheets can be implemented at a high level, consisting of single-compartment firing-rate or integrate-and-fire units. More detailed neuron models can also be used, when required for experimental validation or to simulate specific phenomena. We plan for these models to be implemented using interfaces to existing low-level simulators such as NEURON and GENESIS, and have implemented preliminary versions using NEST.
Software architecture and implementation
Topographica is implemented as a set of packages providing the core functionality, including the graphical user interface (GUI), plus an extensible library of models, analysis routines, and visualizations. The model primitives library consists of objects useful in constructing a model, such as sheets, projections, neural response functions, and learning rules. Many predefined objects are included, and adding new object types is designed to be straightforward. These building blocks are combined into a model using either the GUI or the Python scripting language.
The analysis and visualization libraries include measurement and plotting capabilities geared towards large, two-dimensional areas. They also focus on data displays that can be compared with experimental results, such as optical imaging recordings, for validating models and for generating predictions.
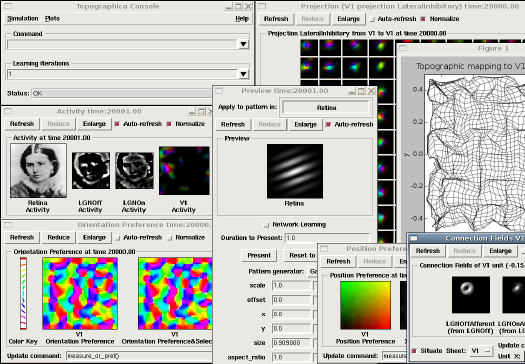
Screenshot of Topographica visualisations
The figure at right shows a Topographica 0.9.1 screenshot with examples of the visualization types supported in that version; the exact contents of each window will vary in other Topographica versions. Here the user is studying the behavior of an orientation map in the primary visual cortex (V1), using a model similar to the one depicted above. The window at the bottom labeled ``Orientation Preference’’ shows the self-organized orientation map in V1; each pixel represents the preferred orientation of cells at that location in the V1 sheet, color-coded using the key at the left. The window labeled ``Activity’’ shows a sample visual image on the left, along with the responses of the OFF-center and ON-center retinal ganglia and LGN (labeled ``LGNOff’’ and ``LGNOn’‘, and V1 (labeled ``Primary’‘). The input pattern was generated using the ``Preview’’ dialog in the center, currently displaying a Gabor-shaped pattern yet to be presented. The window labeled ``Connection Fields’’ shows the strengths of the LGN connections to one neuron in V1. The color-coded lateral inhibitory weights for a regular sampling of the V1 neurons are shown in the ``Projection’’ window at the top; neurons tend to connect to their immediate neighbors and to distant neurons of the same orientation. Distortions in the mapping from retina to V1 are shown in the ``Topographic mapping’’ window, which visualizes the preferred location in retinal space of each V1 neuron. This type of large-scale analysis is difficult with existing simulators, but Topographica is well suited for it.
To allow large models to be executed quickly, the numerically intensive portions of the simulator are implemented in C++. Equally important, however, is that prototyping be fast and flexible, and that new architectures and other extensions be easy to explore and test. Although C++ allows the fine control over machine resources that is necessary for peak performance, it is difficult to write, debug and maintain complex systems in C++ or other similarly high performance languages.
To provide flexibility, the bulk of the simulator is implemented in the Python scripting language. Python is an interactive high-level language that allows rapid software development and interactive debugging, and includes a wide variety of widely supported software libraries for tasks such as data analysis, statistical measurements, and visualization. Unlike the script languages typically included in simulators, Python is a complete, well-defined, mature language with a strong user base. As a result, it enjoys strong support outside of the field of computational neuroscience, which provides much greater flexibility for users, and also makes the task of future maintenance easier.
The following sections will introduce specific features of Topographica, focusing on how they can be used to construct large-scale models of topographic areas. A good way to make this material more concrete is to work through one or more of the Topographica tutorials, to gain experience using Topographica for a particular task. More details about the specific objects discussed can be found in the reference manual.
References
- Shun-ichi Amari. Topographic organization of nerve fields. Bulletin of Mathematical Biology, 42:339-364, 1980.
- James A. Bednar and Risto Miikkulainen. Learning innate face preferences. Neural Computation, 15(7):1525-1557, 2003.
- James A. Bednar and Risto Miikkulainen. Prenatal and postnatal development of laterally connected orientation maps. Neurocomputing, pages 985-992, 2004.
- James A. Bednar, Amol Kelkar, and Risto Miikkulainen. Scaling self-organizing maps to model large cortical networks. Neuroinformatics, 2:275-302, 2004.
- Gary G. Blasdel. Orientation selectivity, preference, and continuity in monkey striate cortex. The Journal of Neuroscience, 12:3139-3161, August 1992.
- James M. Bower and D. Beeman. The Book of GENESIS: Exploring Realistic Neural Models with the GEneral NEural SImulation System. Telos, Santa Clara, CA, second edition, 1998.
- Michael L. Hines and N. T. Carnevale. The NEURON simulation environment. Neural Computation, 9:1179-1209, 1997.
- Jon H. Kaas. Theories of visual cortex organization in primates. Cerebral Cortex, 12:91-125, 1997.
- M. M. Merzenich, P. L. Knight, and G. L. Roth. Representation of cochlea within primary auditory cortex in the cat. Journal of Neurophysiology, 38(2):231-249, 1975.
- Randall C. O’Reilly and Yuko Munakata. Computational Explorations in Cognitive Neuroscience: Understanding the Mind by Simulating the Brain. MIT Press, Cambridge, MA, 2000.
- Antonio Carlos Roque Da Silva Filho. Investigation of a Generalized Version of Amari’s Continuous Model for Neural Networks. PhD thesis, School of Cognitive and Computing Sciences, University of Sussex, Brighton, UK, 1992.
- N. V. Swindale. The development of topography in the visual cortex: A review of models. Network: Computation in Neural Systems, 7:161-247, 1996.
- D. C. Van Essen, J. W. Lewis, H. A. Drury, N. Hadjikhani, R. B. H. Tootell, M. Bakircioglu, and M. I. Miller. Mapping visual cortex in monkeys and humans using surface-based atlases. Vision Research, 41(10-11):1359-1378, 2001.
- Michael Weliky, William H. Bosking, and David Fitzpatrick. A systematic map of direction preference in primary visual cortex. Nature, 379:725-728, 1996.