topo.plotting Package
plotting Package
Topographica plotting subsystem.
Two-dimensional plots are generated by generic classes for visualizing Sheets in any model. The plots are often viewed in a GUI, but they can potentially also be rendered to bitmapped images to save as files, or to display on other types of interfaces such as web servers.
The usual way that a plot is specified is using a PlotGroupTemplate, which specifies a group of related plots. A PlotGroupTemplate is a list of PlotTemplates. Each PlotTemplate will normally produce up to one plot per Sheet in the network, though in special cases it can produce more. The definitions for each of these templates can be done in advance of defining any particular model, and rarely require any editing for any particular model.
For more information, see the various modules in this package.
bitmap Module
Topographica Bitmap Class.
Encapsulates the PIL Image class so that an input matrix can be displayed as a bitmap image without needing to know about PIL proper.
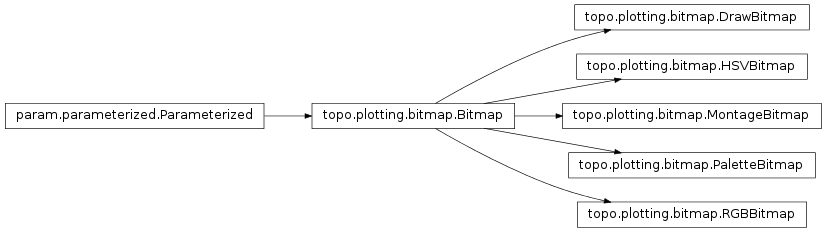
There are three different base image Classes which inherit Bitmap:
PaletteBitmap - 1 2D Matrix, 1 1D Color Map HSVBitmap - 3 2D Matrices, Color (H), Confidence (S), Strength (V) RGBBitmap - 3 2D Matrices, Red, Green, Blue Channels.
All maps are assumed to be on a nominal range of 0.0 to 1.0. Matrices are passed in as part of the constructor and the image is generaed. For more information, see the documentation for each of the Bitmap classes.
The encapsulated PIL Image is accessible through the .bitmap attribute.
- class topo.plotting.bitmap.Bitmap(image)[source]
Bases: param.parameterized.Parameterized
Wrapper class for the PIL Image class.
The main purpose for this base class is to provide a consistent interface for defining bitmaps constructed in various different ways. The resulting bitmap is a PIL Image object that can be accessed using the normal PIL interface.
If subclasses use the _arrayToImage() function provided, any pixels larger than the maximum that can be displayed will be counted before they are clipped; these are stored in the clipped_pixels attribute.
- debug(msg, *args, **kw)
Print msg merged with args as a debugging statement.
See Python’s logging module for details of message formatting.
- defaults()
Return {parameter_name:parameter.default} for all non-constant Parameters.
Note that a Parameter for which instantiate==True has its default instantiated.
- force_new_dynamic_value = <functools.partial object at 0x2b07ac65ecb0>
- get_param_values(onlychanged=False)
Return a list of name,value pairs for all Parameters of this object.
If onlychanged is True, will only return values that are not equal to the default value.
- get_value_generator = <functools.partial object at 0x2b07ac65edb8>
- inspect_value = <functools.partial object at 0x2b07ac65ee10>
- message(msg, *args, **kw)
Print msg merged with args as a message.
See Python’s logging module for details of message formatting.
- classmethod params(parameter_name=None)
Return the Parameters of this class as the dictionary {name: parameter_object}
Includes Parameters from this class and its superclasses.
- pprint(imports=None, prefix=' ', unknown_value='<?>', qualify=False, separator='')
(Experimental) Pretty printed representation that may be evaluated with eval. See pprint() function for more details.
- classmethod print_param_defaults()
Print the default values of all cls’s Parameters.
- print_param_values()
Print the values of all this object’s Parameters.
- script_repr(imports=, []prefix=' ')
Variant of __repr__ designed for generating a runnable script.
- classmethod set_default(param_name, value)
Set the default value of param_name.
Equivalent to setting param_name on the class.
- set_dynamic_time_fn = <functools.partial object at 0x2b07ae48e208>
- set_param = <functools.partial object at 0x2b07ae48e310>
- state_pop()
Restore the most recently saved state.
See state_push() for more details.
- state_push()
Save this instance’s state.
For Parameterized instances, this includes the state of dynamically generated values.
Subclasses that maintain short-term state should additionally save and restore that state using state_push() and state_pop().
Generally, this method is used by operations that need to test something without permanently altering the objects’ state.
- verbose(msg, *args, **kw)
Print msg merged with args as a verbose message.
See Python’s logging module for details of message formatting.
- warning(msg, *args, **kw)
Print msg merged with args as a warning, unless module variable warnings_as_exceptions is True, then raise an Exception containing the arguments.
See Python’s logging module for details of message formatting.
- class topo.plotting.bitmap.PaletteBitmap(inArray, palette=None)[source]
Bases: topo.plotting.bitmap.Bitmap
Bitmap constructed using a single 2D array.
The image is monochrome by default, but more colorful images can be constructed by specifying a Palette.
- debug(msg, *args, **kw)
Print msg merged with args as a debugging statement.
See Python’s logging module for details of message formatting.
- defaults()
Return {parameter_name:parameter.default} for all non-constant Parameters.
Note that a Parameter for which instantiate==True has its default instantiated.
- force_new_dynamic_value = <functools.partial object at 0x2b07ac65ee68>
- get_param_values(onlychanged=False)
Return a list of name,value pairs for all Parameters of this object.
If onlychanged is True, will only return values that are not equal to the default value.
- get_value_generator = <functools.partial object at 0x2b07ac65ef70>
- inspect_value = <functools.partial object at 0x2b07ac65e9f0>
- message(msg, *args, **kw)
Print msg merged with args as a message.
See Python’s logging module for details of message formatting.
- classmethod params(parameter_name=None)
Return the Parameters of this class as the dictionary {name: parameter_object}
Includes Parameters from this class and its superclasses.
- pprint(imports=None, prefix=' ', unknown_value='<?>', qualify=False, separator='')
(Experimental) Pretty printed representation that may be evaluated with eval. See pprint() function for more details.
- classmethod print_param_defaults()
Print the default values of all cls’s Parameters.
- print_param_values()
Print the values of all this object’s Parameters.
- script_repr(imports=, []prefix=' ')
Variant of __repr__ designed for generating a runnable script.
- classmethod set_default(param_name, value)
Set the default value of param_name.
Equivalent to setting param_name on the class.
- set_dynamic_time_fn = <functools.partial object at 0x2b07ae48e310>
- set_param = <functools.partial object at 0x2b07ae48e1b0>
- show()
Renaming of Image.show() for the Bitmap.bitmap attribute.
- state_pop()
Restore the most recently saved state.
See state_push() for more details.
- state_push()
Save this instance’s state.
For Parameterized instances, this includes the state of dynamically generated values.
Subclasses that maintain short-term state should additionally save and restore that state using state_push() and state_pop().
Generally, this method is used by operations that need to test something without permanently altering the objects’ state.
- verbose(msg, *args, **kw)
Print msg merged with args as a verbose message.
See Python’s logging module for details of message formatting.
- warning(msg, *args, **kw)
Print msg merged with args as a warning, unless module variable warnings_as_exceptions is True, then raise an Exception containing the arguments.
See Python’s logging module for details of message formatting.
- zoom(factor)
Return a resized Image object, given the input ‘factor’ parameter. 1.0 is the same size, 2.0 is doubling the height and width, 0.5 is 1/2 the original size. The original Image is not changed.
- class topo.plotting.bitmap.HSVBitmap(hue, sat, val)[source]
Bases: topo.plotting.bitmap.Bitmap
Bitmap constructed from 3 2D arrays, for hue, saturation, and value.
The hue matrix determines the pixel colors. The saturation matrix determines how strongly the pixels are saturated for each hue, i.e. how colorful the pixels appear. The value matrix determines how bright each pixel is.
An RGB image is constructed from the HSV matrices using hsv_to_rgb; the resulting image is of the same type that is constructed by RGBBitmap, and can be used in the same way.
- debug(msg, *args, **kw)
Print msg merged with args as a debugging statement.
See Python’s logging module for details of message formatting.
- defaults()
Return {parameter_name:parameter.default} for all non-constant Parameters.
Note that a Parameter for which instantiate==True has its default instantiated.
- force_new_dynamic_value = <functools.partial object at 0x2b07ac65eaf8>
- get_param_values(onlychanged=False)
Return a list of name,value pairs for all Parameters of this object.
If onlychanged is True, will only return values that are not equal to the default value.
- get_value_generator = <functools.partial object at 0x2b07ac65ec00>
- inspect_value = <functools.partial object at 0x2b07ac65ecb0>
- message(msg, *args, **kw)
Print msg merged with args as a message.
See Python’s logging module for details of message formatting.
- classmethod params(parameter_name=None)
Return the Parameters of this class as the dictionary {name: parameter_object}
Includes Parameters from this class and its superclasses.
- pprint(imports=None, prefix=' ', unknown_value='<?>', qualify=False, separator='')
(Experimental) Pretty printed representation that may be evaluated with eval. See pprint() function for more details.
- classmethod print_param_defaults()
Print the default values of all cls’s Parameters.
- print_param_values()
Print the values of all this object’s Parameters.
- script_repr(imports=, []prefix=' ')
Variant of __repr__ designed for generating a runnable script.
- classmethod set_default(param_name, value)
Set the default value of param_name.
Equivalent to setting param_name on the class.
- set_dynamic_time_fn = <functools.partial object at 0x2b07ae48e1b0>
- set_param = <functools.partial object at 0x2b07ae48e158>
- show()
Renaming of Image.show() for the Bitmap.bitmap attribute.
- state_pop()
Restore the most recently saved state.
See state_push() for more details.
- state_push()
Save this instance’s state.
For Parameterized instances, this includes the state of dynamically generated values.
Subclasses that maintain short-term state should additionally save and restore that state using state_push() and state_pop().
Generally, this method is used by operations that need to test something without permanently altering the objects’ state.
- verbose(msg, *args, **kw)
Print msg merged with args as a verbose message.
See Python’s logging module for details of message formatting.
- warning(msg, *args, **kw)
Print msg merged with args as a warning, unless module variable warnings_as_exceptions is True, then raise an Exception containing the arguments.
See Python’s logging module for details of message formatting.
- zoom(factor)
Return a resized Image object, given the input ‘factor’ parameter. 1.0 is the same size, 2.0 is doubling the height and width, 0.5 is 1/2 the original size. The original Image is not changed.
- class topo.plotting.bitmap.RGBBitmap(rMapArray, gMapArray, bMapArray)[source]
Bases: topo.plotting.bitmap.Bitmap
Bitmap constructed from three 2D arrays, for red, green, and blue.
Each matrix is used as the corresponding channel of an RGB image.
- debug(msg, *args, **kw)
Print msg merged with args as a debugging statement.
See Python’s logging module for details of message formatting.
- defaults()
Return {parameter_name:parameter.default} for all non-constant Parameters.
Note that a Parameter for which instantiate==True has its default instantiated.
- force_new_dynamic_value = <functools.partial object at 0x2b07ac65edb8>
- get_param_values(onlychanged=False)
Return a list of name,value pairs for all Parameters of this object.
If onlychanged is True, will only return values that are not equal to the default value.
- get_value_generator = <functools.partial object at 0x2b07ac65eec0>
- inspect_value = <functools.partial object at 0x2b07ac65ee10>
- message(msg, *args, **kw)
Print msg merged with args as a message.
See Python’s logging module for details of message formatting.
- classmethod params(parameter_name=None)
Return the Parameters of this class as the dictionary {name: parameter_object}
Includes Parameters from this class and its superclasses.
- pprint(imports=None, prefix=' ', unknown_value='<?>', qualify=False, separator='')
(Experimental) Pretty printed representation that may be evaluated with eval. See pprint() function for more details.
- classmethod print_param_defaults()
Print the default values of all cls’s Parameters.
- print_param_values()
Print the values of all this object’s Parameters.
- script_repr(imports=, []prefix=' ')
Variant of __repr__ designed for generating a runnable script.
- classmethod set_default(param_name, value)
Set the default value of param_name.
Equivalent to setting param_name on the class.
- set_dynamic_time_fn = <functools.partial object at 0x2b07ae48e158>
- set_param = <functools.partial object at 0x2b07ae48e208>
- show()
Renaming of Image.show() for the Bitmap.bitmap attribute.
- state_pop()
Restore the most recently saved state.
See state_push() for more details.
- state_push()
Save this instance’s state.
For Parameterized instances, this includes the state of dynamically generated values.
Subclasses that maintain short-term state should additionally save and restore that state using state_push() and state_pop().
Generally, this method is used by operations that need to test something without permanently altering the objects’ state.
- verbose(msg, *args, **kw)
Print msg merged with args as a verbose message.
See Python’s logging module for details of message formatting.
- warning(msg, *args, **kw)
Print msg merged with args as a warning, unless module variable warnings_as_exceptions is True, then raise an Exception containing the arguments.
See Python’s logging module for details of message formatting.
- zoom(factor)
Return a resized Image object, given the input ‘factor’ parameter. 1.0 is the same size, 2.0 is doubling the height and width, 0.5 is 1/2 the original size. The original Image is not changed.
- class topo.plotting.bitmap.MontageBitmap(**params)[source]
Bases: topo.plotting.bitmap.Bitmap
A bitmap composed of tiles containing other bitmaps.
Bitmaps are scaled to fit in the given tile size, and tiled right-to-left, top-to-bottom into the given number of rows and columns.
- param NumericTuple title_pos (allow_None=False, constant=False, default=(10, 10), instantiate=False, length=2, pickle_default_value=True, precedence=None, readonly=False)
- The position of the upper left corner of the title in each tile.
- param Integer resize_filter (allow_None=False, bounds=None, constant=False, default=0, inclusive_bounds=(True, True), instantiate=False, pickle_default_value=True, precedence=None, readonly=False, time_dependent=True, time_fn=<Time Time00001>)
- The filter used for resizing the images. Defaults to NEAREST. See PIL Image module documentation for other options and their meanings.
- param Integer rows (allow_None=False, bounds=None, constant=False, default=2, inclusive_bounds=(True, True), instantiate=False, pickle_default_value=True, precedence=None, readonly=False, time_dependent=True, time_fn=<Time Time00001>)
- The number of rows in the montage.
- param Dict title_options (allow_None=False, constant=False, default={}, instantiate=False, is_instance=True, pickle_default_value=True, precedence=None, readonly=False)
- Dictionary of options for drawing the titles. Dict should contain keyword options for the PIL draw.text method. Possible options include ‘fill’ (fill color), ‘outline’ (outline color), and ‘font’ (an ImageFont font instance). The PIL defaults will be used for any omitted options.
- param List hooks (allow_None=False, bounds=(0, None), constant=False, default=[], instantiate=True, pickle_default_value=True, precedence=None, readonly=False)
- A list of functions, one per tile, that take a PIL image as input and return a PIL image as output. The hooks are applied to the tile images before resizing. The value None can be inserted as a placeholder where no hook function is needed.
- param Integer cols (allow_None=False, bounds=None, constant=False, default=2, inclusive_bounds=(True, True), instantiate=False, pickle_default_value=True, precedence=None, readonly=False, time_dependent=True, time_fn=<Time Time00001>)
- The number of columns in the montage.
- param List bitmaps (allow_None=False, bounds=(0, None), constant=False, default=[], instantiate=True, pickle_default_value=True, precedence=None, readonly=False)
- The list of bitmaps to compose.
- param NumericTuple bg_color (allow_None=False, constant=False, default=(0, 0, 0), instantiate=False, length=3, pickle_default_value=True, precedence=None, readonly=False)
- The background color for the montage, as (r,g,b).
- param Composite shape (allow_None=True, attribs=[‘rows’, ‘cols’], constant=False, default=None, instantiate=False, objtype=<class ‘topo.plotting.bitmap.MontageBitmap’>, pickle_default_value=True, precedence=None, readonly=False)
- The shape of the montage. Same as (self.rows,self.cols).
- param List titles (allow_None=False, bounds=(0, None), constant=False, default=[], instantiate=True, pickle_default_value=True, precedence=None, readonly=False)
- A list of titles to overlay on the tiles.
- param NumericTuple tile_size (allow_None=False, constant=False, default=(100, 100), instantiate=False, length=2, pickle_default_value=True, precedence=None, readonly=False)
- The size in pixels of a tile in the montage.
- param Integer margin (allow_None=False, bounds=None, constant=False, default=5, inclusive_bounds=(True, True), instantiate=False, pickle_default_value=True, precedence=None, readonly=False, time_dependent=True, time_fn=<Time Time00001>)
- The size in pixels of the margin to put around each tile in the montage.
- debug(msg, *args, **kw)
Print msg merged with args as a debugging statement.
See Python’s logging module for details of message formatting.
- defaults()
Return {parameter_name:parameter.default} for all non-constant Parameters.
Note that a Parameter for which instantiate==True has its default instantiated.
- force_new_dynamic_value = <functools.partial object at 0x2b07ac65ef18>
- get_param_values(onlychanged=False)
Return a list of name,value pairs for all Parameters of this object.
If onlychanged is True, will only return values that are not equal to the default value.
- get_value_generator = <functools.partial object at 0x2b07ac65e9f0>
- inspect_value = <functools.partial object at 0x2b07ac65eaa0>
- message(msg, *args, **kw)
Print msg merged with args as a message.
See Python’s logging module for details of message formatting.
- classmethod params(parameter_name=None)
Return the Parameters of this class as the dictionary {name: parameter_object}
Includes Parameters from this class and its superclasses.
- pprint(imports=None, prefix=' ', unknown_value='<?>', qualify=False, separator='')
(Experimental) Pretty printed representation that may be evaluated with eval. See pprint() function for more details.
- classmethod print_param_defaults()
Print the default values of all cls’s Parameters.
- print_param_values()
Print the values of all this object’s Parameters.
- script_repr(imports=, []prefix=' ')
Variant of __repr__ designed for generating a runnable script.
- classmethod set_default(param_name, value)
Set the default value of param_name.
Equivalent to setting param_name on the class.
- set_dynamic_time_fn = <functools.partial object at 0x2b07ae48e208>
- set_param = <functools.partial object at 0x2b07ae48e310>
- show()
Renaming of Image.show() for the Bitmap.bitmap attribute.
- state_pop()
Restore the most recently saved state.
See state_push() for more details.
- state_push()
Save this instance’s state.
For Parameterized instances, this includes the state of dynamically generated values.
Subclasses that maintain short-term state should additionally save and restore that state using state_push() and state_pop().
Generally, this method is used by operations that need to test something without permanently altering the objects’ state.
- verbose(msg, *args, **kw)
Print msg merged with args as a verbose message.
See Python’s logging module for details of message formatting.
- warning(msg, *args, **kw)
Print msg merged with args as a warning, unless module variable warnings_as_exceptions is True, then raise an Exception containing the arguments.
See Python’s logging module for details of message formatting.
- zoom(factor)
Return a resized Image object, given the input ‘factor’ parameter. 1.0 is the same size, 2.0 is doubling the height and width, 0.5 is 1/2 the original size. The original Image is not changed.
- class topo.plotting.bitmap.DrawBitmap(primitive_matrix, box_size)[source]
Bases: topo.plotting.bitmap.Bitmap
Bitmap with primitives drawn for each unit The input matrix has a list of primitives and relative arguments for each unit.
- debug(msg, *args, **kw)
Print msg merged with args as a debugging statement.
See Python’s logging module for details of message formatting.
- defaults()
Return {parameter_name:parameter.default} for all non-constant Parameters.
Note that a Parameter for which instantiate==True has its default instantiated.
- force_new_dynamic_value = <functools.partial object at 0x2b07ac65efc8>
- get_param_values(onlychanged=False)
Return a list of name,value pairs for all Parameters of this object.
If onlychanged is True, will only return values that are not equal to the default value.
- get_value_generator = <functools.partial object at 0x2b07ac65edb8>
- inspect_value = <functools.partial object at 0x2b07ae48e730>
- message(msg, *args, **kw)
Print msg merged with args as a message.
See Python’s logging module for details of message formatting.
- classmethod params(parameter_name=None)
Return the Parameters of this class as the dictionary {name: parameter_object}
Includes Parameters from this class and its superclasses.
- pprint(imports=None, prefix=' ', unknown_value='<?>', qualify=False, separator='')
(Experimental) Pretty printed representation that may be evaluated with eval. See pprint() function for more details.
- classmethod print_param_defaults()
Print the default values of all cls’s Parameters.
- print_param_values()
Print the values of all this object’s Parameters.
- script_repr(imports=, []prefix=' ')
Variant of __repr__ designed for generating a runnable script.
- classmethod set_default(param_name, value)
Set the default value of param_name.
Equivalent to setting param_name on the class.
- set_dynamic_time_fn = <functools.partial object at 0x2b07ae48e310>
- set_param = <functools.partial object at 0x2b07ae48e260>
- show()
Renaming of Image.show() for the Bitmap.bitmap attribute.
- state_pop()
Restore the most recently saved state.
See state_push() for more details.
- state_push()
Save this instance’s state.
For Parameterized instances, this includes the state of dynamically generated values.
Subclasses that maintain short-term state should additionally save and restore that state using state_push() and state_pop().
Generally, this method is used by operations that need to test something without permanently altering the objects’ state.
- verbose(msg, *args, **kw)
Print msg merged with args as a verbose message.
See Python’s logging module for details of message formatting.
- warning(msg, *args, **kw)
Print msg merged with args as a warning, unless module variable warnings_as_exceptions is True, then raise an Exception containing the arguments.
See Python’s logging module for details of message formatting.
- zoom(factor)
Return a resized Image object, given the input ‘factor’ parameter. 1.0 is the same size, 2.0 is doubling the height and width, 0.5 is 1/2 the original size. The original Image is not changed.
plot Module
Plot class.
- class topo.plotting.plot.MultiOrPlot(channels, sheet_views, density, plot_bounding_box, normalize, range_=False, **params)[source]
Bases: topo.plotting.plot.TemplatePlot
Bitmap plot with oriented lines draws for every units, representing the most preferred orientations. Constructs a matrix of drawing directives displaying oriented lines in each unit, colored according to the order or preference, and selectivity This plot expects channels named “OrX” “SelX”, with “X” the number ranking the preferred orientations.
- param Number max_brightness (allow_None=False, bounds=(50, 100), constant=False, default=90, inclusive_bounds=(True, True), instantiate=False, pickle_default_value=True, precedence=None, readonly=False, time_dependent=True, time_fn=<Time Time00001>)
- max brightness of lines
- param Number warn_time (allow_None=False, bounds=None, constant=False, default=-2, inclusive_bounds=(True, True), instantiate=False, pickle_default_value=True, precedence=-1, readonly=False, time_dependent=True, time_fn=<Time Time00001>)
- Time last warned about stale plots
- param Number unit_size (allow_None=False, bounds=(9, None), constant=False, default=25, inclusive_bounds=(True, True), instantiate=False, pickle_default_value=True, precedence=None, readonly=False, time_dependent=True, time_fn=<Time Time00001>)
- box size of a single unit
- param Number min_brightness (allow_None=False, bounds=(0, 50), constant=False, default=30, inclusive_bounds=(True, True), instantiate=False, pickle_default_value=True, precedence=None, readonly=False, time_dependent=True, time_fn=<Time Time00001>)
- min brightness of lines
- param Number staleness_warning (allow_None=False, bounds=(0, None), constant=False, default=10, inclusive_bounds=(True, True), instantiate=False, pickle_default_value=True, precedence=None, readonly=False, time_dependent=True, time_fn=<Time Time00001>)
- Time length allowed between bitmaps making up a single plot before warning. If the difference between the Image with the earliest timestamp and the one with the latest timestamp is larger than this parameter’s value, produce a warning.
- debug(msg, *args, **kw)
Print msg merged with args as a debugging statement.
See Python’s logging module for details of message formatting.
- defaults()
Return {parameter_name:parameter.default} for all non-constant Parameters.
Note that a Parameter for which instantiate==True has its default instantiated.
- force_new_dynamic_value = <functools.partial object at 0x2b07aea57158>
- get_param_values(onlychanged=False)
Return a list of name,value pairs for all Parameters of this object.
If onlychanged is True, will only return values that are not equal to the default value.
- get_value_generator = <functools.partial object at 0x2b07aea571b0>
- inspect_value = <functools.partial object at 0x2b07aea57260>
- label()
Return a label for this plot.
- message(msg, *args, **kw)
Print msg merged with args as a message.
See Python’s logging module for details of message formatting.
- classmethod params(parameter_name=None)
Return the Parameters of this class as the dictionary {name: parameter_object}
Includes Parameters from this class and its superclasses.
- pprint(imports=None, prefix=' ', unknown_value='<?>', qualify=False, separator='')
(Experimental) Pretty printed representation that may be evaluated with eval. See pprint() function for more details.
- classmethod print_param_defaults()
Print the default values of all cls’s Parameters.
- print_param_values()
Print the values of all this object’s Parameters.
- rescale(scale_factor)
Change the size of this image by the specified numerical factor.
The original image is kept as-is in _orig_bitmap; the scaled image is stored in bitmap. The scale_factor argument is taken as relative to the current scaling of the bitmap. For instance, calling scale(1.5) followed by scale(2.0) will yield a final scale of 3.0, not 2.0.
- script_repr(imports=, []prefix=' ')
Variant of __repr__ designed for generating a runnable script.
- classmethod set_default(param_name, value)
Set the default value of param_name.
Equivalent to setting param_name on the class.
- set_dynamic_time_fn = <functools.partial object at 0x2b07aea57208>
- set_param = <functools.partial object at 0x2b07aea57368>
- set_scale(scale_factor)
Specify the numerical value of the scaling factor for this image.
The original image is kept as-is in _orig_bitmap; the scaled image is stored in bitmap. The scale_factor argument is taken as relative to the original size of the bitmap. For instance, calling scale(1.5) followed by scale(2.0) will yield a final scale of 2.0, not 3.0.
- state_pop()
Restore the most recently saved state.
See state_push() for more details.
- state_push()
Save this instance’s state.
For Parameterized instances, this includes the state of dynamically generated values.
Subclasses that maintain short-term state should additionally save and restore that state using state_push() and state_pop().
Generally, this method is used by operations that need to test something without permanently altering the objects’ state.
- verbose(msg, *args, **kw)
Print msg merged with args as a verbose message.
See Python’s logging module for details of message formatting.
- warning(msg, *args, **kw)
Print msg merged with args as a warning, unless module variable warnings_as_exceptions is True, then raise an Exception containing the arguments.
See Python’s logging module for details of message formatting.
- class topo.plotting.plot.PalettePlot(channels, sheet_views, density, plot_bounding_box, normalize, **params)[source]
Bases: topo.plotting.plot.TemplatePlot
Bitmap plot based on a Strength matrix, with optional colorization.
Not yet implemented.
When implemented, construct an RGB plot from a Strength channel, optionally colorized using a specified Palette.
- param Number warn_time (allow_None=False, bounds=None, constant=False, default=-2, inclusive_bounds=(True, True), instantiate=False, pickle_default_value=True, precedence=-1, readonly=False, time_dependent=True, time_fn=<Time Time00001>)
- Time last warned about stale plots
- param Number staleness_warning (allow_None=False, bounds=(0, None), constant=False, default=10, inclusive_bounds=(True, True), instantiate=False, pickle_default_value=True, precedence=None, readonly=False, time_dependent=True, time_fn=<Time Time00001>)
- Time length allowed between bitmaps making up a single plot before warning. If the difference between the Image with the earliest timestamp and the one with the latest timestamp is larger than this parameter’s value, produce a warning.
- debug(msg, *args, **kw)
Print msg merged with args as a debugging statement.
See Python’s logging module for details of message formatting.
- defaults()
Return {parameter_name:parameter.default} for all non-constant Parameters.
Note that a Parameter for which instantiate==True has its default instantiated.
- force_new_dynamic_value = <functools.partial object at 0x2b07aea6a158>
- get_param_values(onlychanged=False)
Return a list of name,value pairs for all Parameters of this object.
If onlychanged is True, will only return values that are not equal to the default value.
- get_value_generator = <functools.partial object at 0x2b07aea6a1b0>
- inspect_value = <functools.partial object at 0x2b07aea6a260>
- label()
Return a label for this plot.
- message(msg, *args, **kw)
Print msg merged with args as a message.
See Python’s logging module for details of message formatting.
- classmethod params(parameter_name=None)
Return the Parameters of this class as the dictionary {name: parameter_object}
Includes Parameters from this class and its superclasses.
- pprint(imports=None, prefix=' ', unknown_value='<?>', qualify=False, separator='')
(Experimental) Pretty printed representation that may be evaluated with eval. See pprint() function for more details.
- classmethod print_param_defaults()
Print the default values of all cls’s Parameters.
- print_param_values()
Print the values of all this object’s Parameters.
- rescale(scale_factor)
Change the size of this image by the specified numerical factor.
The original image is kept as-is in _orig_bitmap; the scaled image is stored in bitmap. The scale_factor argument is taken as relative to the current scaling of the bitmap. For instance, calling scale(1.5) followed by scale(2.0) will yield a final scale of 3.0, not 2.0.
- script_repr(imports=, []prefix=' ')
Variant of __repr__ designed for generating a runnable script.
- classmethod set_default(param_name, value)
Set the default value of param_name.
Equivalent to setting param_name on the class.
- set_dynamic_time_fn = <functools.partial object at 0x2b07aea6a208>
- set_param = <functools.partial object at 0x2b07aea6a368>
- set_scale(scale_factor)
Specify the numerical value of the scaling factor for this image.
The original image is kept as-is in _orig_bitmap; the scaled image is stored in bitmap. The scale_factor argument is taken as relative to the original size of the bitmap. For instance, calling scale(1.5) followed by scale(2.0) will yield a final scale of 2.0, not 3.0.
- state_pop()
Restore the most recently saved state.
See state_push() for more details.
- state_push()
Save this instance’s state.
For Parameterized instances, this includes the state of dynamically generated values.
Subclasses that maintain short-term state should additionally save and restore that state using state_push() and state_pop().
Generally, this method is used by operations that need to test something without permanently altering the objects’ state.
- verbose(msg, *args, **kw)
Print msg merged with args as a verbose message.
See Python’s logging module for details of message formatting.
- warning(msg, *args, **kw)
Print msg merged with args as a warning, unless module variable warnings_as_exceptions is True, then raise an Exception containing the arguments.
See Python’s logging module for details of message formatting.
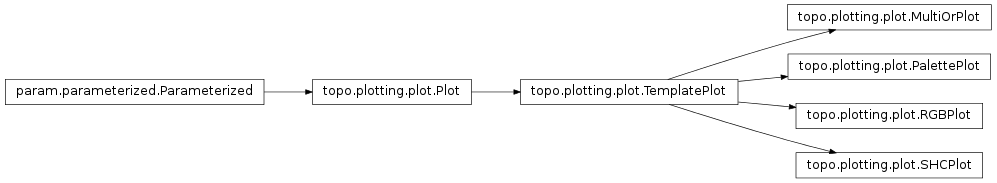
- class topo.plotting.plot.Plot(image=None, **params)[source]
Bases: param.parameterized.Parameterized
Simple Plot object constructed from a specified PIL image.
- param Number staleness_warning (allow_None=False, bounds=(0, None), constant=False, default=10, inclusive_bounds=(True, True), instantiate=False, pickle_default_value=True, precedence=None, readonly=False, time_dependent=True, time_fn=<Time Time00001>)
- Time length allowed between bitmaps making up a single plot before warning. If the difference between the Image with the earliest timestamp and the one with the latest timestamp is larger than this parameter’s value, produce a warning.
- debug(msg, *args, **kw)
Print msg merged with args as a debugging statement.
See Python’s logging module for details of message formatting.
- defaults()
Return {parameter_name:parameter.default} for all non-constant Parameters.
Note that a Parameter for which instantiate==True has its default instantiated.
- force_new_dynamic_value = <functools.partial object at 0x2b07aea6a1b0>
- get_param_values(onlychanged=False)
Return a list of name,value pairs for all Parameters of this object.
If onlychanged is True, will only return values that are not equal to the default value.
- get_value_generator = <functools.partial object at 0x2b07aea6a208>
- inspect_value = <functools.partial object at 0x2b07aea6a260>
- message(msg, *args, **kw)
Print msg merged with args as a message.
See Python’s logging module for details of message formatting.
- classmethod params(parameter_name=None)
Return the Parameters of this class as the dictionary {name: parameter_object}
Includes Parameters from this class and its superclasses.
- pprint(imports=None, prefix=' ', unknown_value='<?>', qualify=False, separator='')
(Experimental) Pretty printed representation that may be evaluated with eval. See pprint() function for more details.
- classmethod print_param_defaults()
Print the default values of all cls’s Parameters.
- print_param_values()
Print the values of all this object’s Parameters.
- rescale(scale_factor)[source]
Change the size of this image by the specified numerical factor.
The original image is kept as-is in _orig_bitmap; the scaled image is stored in bitmap. The scale_factor argument is taken as relative to the current scaling of the bitmap. For instance, calling scale(1.5) followed by scale(2.0) will yield a final scale of 3.0, not 2.0.
- script_repr(imports=, []prefix=' ')
Variant of __repr__ designed for generating a runnable script.
- classmethod set_default(param_name, value)
Set the default value of param_name.
Equivalent to setting param_name on the class.
- set_dynamic_time_fn = <functools.partial object at 0x2b07aea6a158>
- set_param = <functools.partial object at 0x2b07aea6a310>
- set_scale(scale_factor)[source]
Specify the numerical value of the scaling factor for this image.
The original image is kept as-is in _orig_bitmap; the scaled image is stored in bitmap. The scale_factor argument is taken as relative to the original size of the bitmap. For instance, calling scale(1.5) followed by scale(2.0) will yield a final scale of 2.0, not 3.0.
- state_pop()
Restore the most recently saved state.
See state_push() for more details.
- state_push()
Save this instance’s state.
For Parameterized instances, this includes the state of dynamically generated values.
Subclasses that maintain short-term state should additionally save and restore that state using state_push() and state_pop().
Generally, this method is used by operations that need to test something without permanently altering the objects’ state.
- verbose(msg, *args, **kw)
Print msg merged with args as a verbose message.
See Python’s logging module for details of message formatting.
- warning(msg, *args, **kw)
Print msg merged with args as a warning, unless module variable warnings_as_exceptions is True, then raise an Exception containing the arguments.
See Python’s logging module for details of message formatting.
- class topo.plotting.plot.RGBPlot(channels, sheet_views, density, plot_bounding_box, normalize, range_=False, **params)[source]
Bases: topo.plotting.plot.TemplatePlot
Bitmap plot based on Red, Green, and Blue matrices.
Construct an RGB (red, green, and blue) plot from the Red, Green, and Blue channels.
- param Number warn_time (allow_None=False, bounds=None, constant=False, default=-2, inclusive_bounds=(True, True), instantiate=False, pickle_default_value=True, precedence=-1, readonly=False, time_dependent=True, time_fn=<Time Time00001>)
- Time last warned about stale plots
- param Number staleness_warning (allow_None=False, bounds=(0, None), constant=False, default=10, inclusive_bounds=(True, True), instantiate=False, pickle_default_value=True, precedence=None, readonly=False, time_dependent=True, time_fn=<Time Time00001>)
- Time length allowed between bitmaps making up a single plot before warning. If the difference between the Image with the earliest timestamp and the one with the latest timestamp is larger than this parameter’s value, produce a warning.
- debug(msg, *args, **kw)
Print msg merged with args as a debugging statement.
See Python’s logging module for details of message formatting.
- defaults()
Return {parameter_name:parameter.default} for all non-constant Parameters.
Note that a Parameter for which instantiate==True has its default instantiated.
- force_new_dynamic_value = <functools.partial object at 0x2b07aea6a158>
- get_param_values(onlychanged=False)
Return a list of name,value pairs for all Parameters of this object.
If onlychanged is True, will only return values that are not equal to the default value.
- get_value_generator = <functools.partial object at 0x2b07aea6a310>
- inspect_value = <functools.partial object at 0x2b07aea6a050>
- label()
Return a label for this plot.
- message(msg, *args, **kw)
Print msg merged with args as a message.
See Python’s logging module for details of message formatting.
- classmethod params(parameter_name=None)
Return the Parameters of this class as the dictionary {name: parameter_object}
Includes Parameters from this class and its superclasses.
- pprint(imports=None, prefix=' ', unknown_value='<?>', qualify=False, separator='')
(Experimental) Pretty printed representation that may be evaluated with eval. See pprint() function for more details.
- classmethod print_param_defaults()
Print the default values of all cls’s Parameters.
- print_param_values()
Print the values of all this object’s Parameters.
- rescale(scale_factor)
Change the size of this image by the specified numerical factor.
The original image is kept as-is in _orig_bitmap; the scaled image is stored in bitmap. The scale_factor argument is taken as relative to the current scaling of the bitmap. For instance, calling scale(1.5) followed by scale(2.0) will yield a final scale of 3.0, not 2.0.
- script_repr(imports=, []prefix=' ')
Variant of __repr__ designed for generating a runnable script.
- classmethod set_default(param_name, value)
Set the default value of param_name.
Equivalent to setting param_name on the class.
- set_dynamic_time_fn = <functools.partial object at 0x2b07aea6a0a8>
- set_param = <functools.partial object at 0x2b07aea6a368>
- set_scale(scale_factor)
Specify the numerical value of the scaling factor for this image.
The original image is kept as-is in _orig_bitmap; the scaled image is stored in bitmap. The scale_factor argument is taken as relative to the original size of the bitmap. For instance, calling scale(1.5) followed by scale(2.0) will yield a final scale of 2.0, not 3.0.
- state_pop()
Restore the most recently saved state.
See state_push() for more details.
- state_push()
Save this instance’s state.
For Parameterized instances, this includes the state of dynamically generated values.
Subclasses that maintain short-term state should additionally save and restore that state using state_push() and state_pop().
Generally, this method is used by operations that need to test something without permanently altering the objects’ state.
- verbose(msg, *args, **kw)
Print msg merged with args as a verbose message.
See Python’s logging module for details of message formatting.
- warning(msg, *args, **kw)
Print msg merged with args as a warning, unless module variable warnings_as_exceptions is True, then raise an Exception containing the arguments.
See Python’s logging module for details of message formatting.
- class topo.plotting.plot.SHCPlot(channels, sheet_views, density, plot_bounding_box, normalize, range_=False, **params)[source]
Bases: topo.plotting.plot.TemplatePlot
Bitmap plot based on Strength, Hue, and Confidence matrices.
Constructs an HSV (hue, saturation, and value) plot by choosing the appropriate matrix for each channel.
- param Number warn_time (allow_None=False, bounds=None, constant=False, default=-2, inclusive_bounds=(True, True), instantiate=False, pickle_default_value=True, precedence=-1, readonly=False, time_dependent=True, time_fn=<Time Time00001>)
- Time last warned about stale plots
- param Number staleness_warning (allow_None=False, bounds=(0, None), constant=False, default=10, inclusive_bounds=(True, True), instantiate=False, pickle_default_value=True, precedence=None, readonly=False, time_dependent=True, time_fn=<Time Time00001>)
- Time length allowed between bitmaps making up a single plot before warning. If the difference between the Image with the earliest timestamp and the one with the latest timestamp is larger than this parameter’s value, produce a warning.
- debug(msg, *args, **kw)
Print msg merged with args as a debugging statement.
See Python’s logging module for details of message formatting.
- defaults()
Return {parameter_name:parameter.default} for all non-constant Parameters.
Note that a Parameter for which instantiate==True has its default instantiated.
- force_new_dynamic_value = <functools.partial object at 0x2b07aea6a1b0>
- get_param_values(onlychanged=False)
Return a list of name,value pairs for all Parameters of this object.
If onlychanged is True, will only return values that are not equal to the default value.
- get_value_generator = <functools.partial object at 0x2b07aea6a208>
- inspect_value = <functools.partial object at 0x2b07aea6a260>
- label()
Return a label for this plot.
- message(msg, *args, **kw)
Print msg merged with args as a message.
See Python’s logging module for details of message formatting.
- classmethod params(parameter_name=None)
Return the Parameters of this class as the dictionary {name: parameter_object}
Includes Parameters from this class and its superclasses.
- pprint(imports=None, prefix=' ', unknown_value='<?>', qualify=False, separator='')
(Experimental) Pretty printed representation that may be evaluated with eval. See pprint() function for more details.
- classmethod print_param_defaults()
Print the default values of all cls’s Parameters.
- print_param_values()
Print the values of all this object’s Parameters.
- rescale(scale_factor)
Change the size of this image by the specified numerical factor.
The original image is kept as-is in _orig_bitmap; the scaled image is stored in bitmap. The scale_factor argument is taken as relative to the current scaling of the bitmap. For instance, calling scale(1.5) followed by scale(2.0) will yield a final scale of 3.0, not 2.0.
- script_repr(imports=, []prefix=' ')
Variant of __repr__ designed for generating a runnable script.
- classmethod set_default(param_name, value)
Set the default value of param_name.
Equivalent to setting param_name on the class.
- set_dynamic_time_fn = <functools.partial object at 0x2b07aea6a2b8>
- set_param = <functools.partial object at 0x2b07aea6a368>
- set_scale(scale_factor)
Specify the numerical value of the scaling factor for this image.
The original image is kept as-is in _orig_bitmap; the scaled image is stored in bitmap. The scale_factor argument is taken as relative to the original size of the bitmap. For instance, calling scale(1.5) followed by scale(2.0) will yield a final scale of 2.0, not 3.0.
- state_pop()
Restore the most recently saved state.
See state_push() for more details.
- state_push()
Save this instance’s state.
For Parameterized instances, this includes the state of dynamically generated values.
Subclasses that maintain short-term state should additionally save and restore that state using state_push() and state_pop().
Generally, this method is used by operations that need to test something without permanently altering the objects’ state.
- verbose(msg, *args, **kw)
Print msg merged with args as a verbose message.
See Python’s logging module for details of message formatting.
- warning(msg, *args, **kw)
Print msg merged with args as a warning, unless module variable warnings_as_exceptions is True, then raise an Exception containing the arguments.
See Python’s logging module for details of message formatting.
- class topo.plotting.plot.TemplatePlot(channels, sheet_views, density, plot_bounding_box, normalize, range_=False, **params)[source]
Bases: topo.plotting.plot.Plot
A bitmap-based plot as specified by a plot template (or plot channels).
- param Number warn_time (allow_None=False, bounds=None, constant=False, default=-2, inclusive_bounds=(True, True), instantiate=False, pickle_default_value=True, precedence=-1, readonly=False, time_dependent=True, time_fn=<Time Time00001>)
- Time last warned about stale plots
- param Number staleness_warning (allow_None=False, bounds=(0, None), constant=False, default=10, inclusive_bounds=(True, True), instantiate=False, pickle_default_value=True, precedence=None, readonly=False, time_dependent=True, time_fn=<Time Time00001>)
- Time length allowed between bitmaps making up a single plot before warning. If the difference between the Image with the earliest timestamp and the one with the latest timestamp is larger than this parameter’s value, produce a warning.
- debug(msg, *args, **kw)
Print msg merged with args as a debugging statement.
See Python’s logging module for details of message formatting.
- defaults()
Return {parameter_name:parameter.default} for all non-constant Parameters.
Note that a Parameter for which instantiate==True has its default instantiated.
- force_new_dynamic_value = <functools.partial object at 0x2b07aea6a0a8>
- get_param_values(onlychanged=False)
Return a list of name,value pairs for all Parameters of this object.
If onlychanged is True, will only return values that are not equal to the default value.
- get_value_generator = <functools.partial object at 0x2b07aea6a050>
- inspect_value = <functools.partial object at 0x2b07aea6a100>
- label()
Return a label for this plot.
- message(msg, *args, **kw)
Print msg merged with args as a message.
See Python’s logging module for details of message formatting.
- classmethod params(parameter_name=None)
Return the Parameters of this class as the dictionary {name: parameter_object}
Includes Parameters from this class and its superclasses.
- pprint(imports=None, prefix=' ', unknown_value='<?>', qualify=False, separator='')
(Experimental) Pretty printed representation that may be evaluated with eval. See pprint() function for more details.
- classmethod print_param_defaults()
Print the default values of all cls’s Parameters.
- print_param_values()
Print the values of all this object’s Parameters.
- rescale(scale_factor)
Change the size of this image by the specified numerical factor.
The original image is kept as-is in _orig_bitmap; the scaled image is stored in bitmap. The scale_factor argument is taken as relative to the current scaling of the bitmap. For instance, calling scale(1.5) followed by scale(2.0) will yield a final scale of 3.0, not 2.0.
- script_repr(imports=, []prefix=' ')
Variant of __repr__ designed for generating a runnable script.
- classmethod set_default(param_name, value)
Set the default value of param_name.
Equivalent to setting param_name on the class.
- set_dynamic_time_fn = <functools.partial object at 0x2b07aea6a158>
- set_param = <functools.partial object at 0x2b07aea6a418>
- set_scale(scale_factor)
Specify the numerical value of the scaling factor for this image.
The original image is kept as-is in _orig_bitmap; the scaled image is stored in bitmap. The scale_factor argument is taken as relative to the original size of the bitmap. For instance, calling scale(1.5) followed by scale(2.0) will yield a final scale of 2.0, not 3.0.
- state_pop()
Restore the most recently saved state.
See state_push() for more details.
- state_push()
Save this instance’s state.
For Parameterized instances, this includes the state of dynamically generated values.
Subclasses that maintain short-term state should additionally save and restore that state using state_push() and state_pop().
Generally, this method is used by operations that need to test something without permanently altering the objects’ state.
- verbose(msg, *args, **kw)
Print msg merged with args as a verbose message.
See Python’s logging module for details of message formatting.
- warning(msg, *args, **kw)
Print msg merged with args as a warning, unless module variable warnings_as_exceptions is True, then raise an Exception containing the arguments.
See Python’s logging module for details of message formatting.
- topo.plotting.plot.make_template_plot(channels, sheet_views, density=None, plot_bounding_box=None, normalize='None', name='None', range_=False)[source]
Factory function for constructing a Plot object whose type is not yet known.
Typically, a TemplatePlot will be constructed through this call, because it selects the appropriate type automatically, rather than calling one of the Plot subclasses automatically. See TemplatePlot.__init__ for a description of the arguments.
plotfilesaver Module

File saving routines for plots.
Typically called using save_plotgroup in commands/analysis.py, but these objects can also be instantiated explicitly, to save a series of plots.
- class topo.plotting.plotfilesaver.CFProjectionPlotGroupSaver(plotgroup, **params)[source]
Bases: topo.plotting.plotfilesaver.PlotGroupSaver
Allows a CFProjectionPlotGroup to be saved as a bitmap file, concatenating all the CF plots into a single image.
- param String filename_format (allow_None=False, basestring=<type ‘basestring’>, constant=False, default=%(filename_prefix)s%(basename)s_%(plot_label)s%(filename_suffix)s.%(file_format)s, instantiate=False, pickle_default_value=True, precedence=None, readonly=False)
- Format string to use for generating filenames for plots. This string will be evaluated in the context of a dictionary that defines various items commonly used when generating filenames, including:: basename: the default sim.basename(), usually name+time() time: the current simulation time (topo.sim.time()) sim_name: the name of the current simulation (topo.sim.name) plot_label: the label specfied in the PlotGroup for this plot file_format: the bitmap image file format for this type of plot plotgroup_name: the name of this PlotGroup
- param String filename_prefix (allow_None=False, basestring=<type ‘basestring’>, constant=False, default=, instantiate=False, pickle_default_value=True, precedence=None, readonly=False)
- Optional prefix that can be used in the filename_format command to disambiguate different simulations or conditions.
- param String filename_suffix (allow_None=False, basestring=<type ‘basestring’>, constant=False, default=, instantiate=False, pickle_default_value=True, precedence=None, readonly=False)
- Optional suffix that can be used in the filename_format command to disambiguate different simulations or conditions.
- param String file_format (allow_None=False, basestring=<type ‘basestring’>, constant=False, default=png, instantiate=False, pickle_default_value=True, precedence=None, readonly=False)
- Bitmap image file format to use.
- debug(msg, *args, **kw)
Print msg merged with args as a debugging statement.
See Python’s logging module for details of message formatting.
- defaults()
Return {parameter_name:parameter.default} for all non-constant Parameters.
Note that a Parameter for which instantiate==True has its default instantiated.
- filename(label, **params)
Calculate a specific filename from the filename_format.
- force_new_dynamic_value = <functools.partial object at 0x2b07ab259cb0>
- get_param_values(onlychanged=False)
Return a list of name,value pairs for all Parameters of this object.
If onlychanged is True, will only return values that are not equal to the default value.
- get_value_generator = <functools.partial object at 0x2b07ab259b50>
- inspect_value = <functools.partial object at 0x2b07ab259db8>
- message(msg, *args, **kw)
Print msg merged with args as a message.
See Python’s logging module for details of message formatting.
- classmethod params(parameter_name=None)
Return the Parameters of this class as the dictionary {name: parameter_object}
Includes Parameters from this class and its superclasses.
- pprint(imports=None, prefix=' ', unknown_value='<?>', qualify=False, separator='')
(Experimental) Pretty printed representation that may be evaluated with eval. See pprint() function for more details.
- classmethod print_param_defaults()
Print the default values of all cls’s Parameters.
- print_param_values()
Print the values of all this object’s Parameters.
- script_repr(imports=, []prefix=' ')
Variant of __repr__ designed for generating a runnable script.
- classmethod set_default(param_name, value)
Set the default value of param_name.
Equivalent to setting param_name on the class.
- set_dynamic_time_fn = <functools.partial object at 0x2b07ab259d60>
- set_param = <functools.partial object at 0x2b07ab259ec0>
- state_pop()
Restore the most recently saved state.
See state_push() for more details.
- state_push()
Save this instance’s state.
For Parameterized instances, this includes the state of dynamically generated values.
Subclasses that maintain short-term state should additionally save and restore that state using state_push() and state_pop().
Generally, this method is used by operations that need to test something without permanently altering the objects’ state.
- strip(filename)
Strip inappropriate characters from a filename.
- verbose(msg, *args, **kw)
Print msg merged with args as a verbose message.
See Python’s logging module for details of message formatting.
- warning(msg, *args, **kw)
Print msg merged with args as a warning, unless module variable warnings_as_exceptions is True, then raise an Exception containing the arguments.
See Python’s logging module for details of message formatting.
- class topo.plotting.plotfilesaver.PlotGroupSaver(plotgroup, **params)[source]
Bases: param.parameterized.Parameterized
Allows a PlotGroup to be saved as a set of bitmap files on disk.
- param String filename_format (allow_None=False, basestring=<type ‘basestring’>, constant=False, default=%(filename_prefix)s%(basename)s_%(plot_label)s%(filename_suffix)s.%(file_format)s, instantiate=False, pickle_default_value=True, precedence=None, readonly=False)
- Format string to use for generating filenames for plots. This string will be evaluated in the context of a dictionary that defines various items commonly used when generating filenames, including:: basename: the default sim.basename(), usually name+time() time: the current simulation time (topo.sim.time()) sim_name: the name of the current simulation (topo.sim.name) plot_label: the label specfied in the PlotGroup for this plot file_format: the bitmap image file format for this type of plot plotgroup_name: the name of this PlotGroup
- param String filename_prefix (allow_None=False, basestring=<type ‘basestring’>, constant=False, default=, instantiate=False, pickle_default_value=True, precedence=None, readonly=False)
- Optional prefix that can be used in the filename_format command to disambiguate different simulations or conditions.
- param String filename_suffix (allow_None=False, basestring=<type ‘basestring’>, constant=False, default=, instantiate=False, pickle_default_value=True, precedence=None, readonly=False)
- Optional suffix that can be used in the filename_format command to disambiguate different simulations or conditions.
- param String file_format (allow_None=False, basestring=<type ‘basestring’>, constant=False, default=png, instantiate=False, pickle_default_value=True, precedence=None, readonly=False)
- Bitmap image file format to use.
- debug(msg, *args, **kw)
Print msg merged with args as a debugging statement.
See Python’s logging module for details of message formatting.
- defaults()
Return {parameter_name:parameter.default} for all non-constant Parameters.
Note that a Parameter for which instantiate==True has its default instantiated.
- force_new_dynamic_value = <functools.partial object at 0x2b07ab259ba8>
- get_param_values(onlychanged=False)
Return a list of name,value pairs for all Parameters of this object.
If onlychanged is True, will only return values that are not equal to the default value.
- get_value_generator = <functools.partial object at 0x2b07ab259af8>
- inspect_value = <functools.partial object at 0x2b07ab259c00>
- message(msg, *args, **kw)
Print msg merged with args as a message.
See Python’s logging module for details of message formatting.
- classmethod params(parameter_name=None)
Return the Parameters of this class as the dictionary {name: parameter_object}
Includes Parameters from this class and its superclasses.
- pprint(imports=None, prefix=' ', unknown_value='<?>', qualify=False, separator='')
(Experimental) Pretty printed representation that may be evaluated with eval. See pprint() function for more details.
- classmethod print_param_defaults()
Print the default values of all cls’s Parameters.
- print_param_values()
Print the values of all this object’s Parameters.
- script_repr(imports=, []prefix=' ')
Variant of __repr__ designed for generating a runnable script.
- classmethod set_default(param_name, value)
Set the default value of param_name.
Equivalent to setting param_name on the class.
- set_dynamic_time_fn = <functools.partial object at 0x2b07ab259db8>
- set_param = <functools.partial object at 0x2b07ab259e68>
- state_pop()
Restore the most recently saved state.
See state_push() for more details.
- state_push()
Save this instance’s state.
For Parameterized instances, this includes the state of dynamically generated values.
Subclasses that maintain short-term state should additionally save and restore that state using state_push() and state_pop().
Generally, this method is used by operations that need to test something without permanently altering the objects’ state.
- verbose(msg, *args, **kw)
Print msg merged with args as a verbose message.
See Python’s logging module for details of message formatting.
- warning(msg, *args, **kw)
Print msg merged with args as a warning, unless module variable warnings_as_exceptions is True, then raise an Exception containing the arguments.
See Python’s logging module for details of message formatting.
- topo.plotting.plotfilesaver.make_contact_sheet(imgs, (marl, mart, marr, marb), padding)[source]
Make a contact sheet (image grid) from a 2D array of PIL images:
imgs     2D array of images

marl     The left margin in pixels
mart     The top margin in pixels
marr     The right margin in pixels
marb     The bottom margin in pixels

padding  The padding between images in pixels
Returns a PIL image object.
plotgroup Module

Hierarchy of PlotGroup classes, i.e. output-device-independent sets of plots.
Includes PlotGroups for standard plots of anything in a Sheet database, plus weight plots for one unit, and projections.
- class topo.plotting.plotgroup.CFProjectionPlotGroup(**params)[source]
Bases: topo.plotting.plotgroup.ProjectionPlotGroup
Visualize one CFProjection.
- param ObjectSelector normalize (allow_None=None, check_on_set=True, compute_default_fn=None, constant=False, default=None, instantiate=False, objects=[‘None’, ‘Individually’, ‘AllTogether’, ‘JointProjections’], pickle_default_value=True, precedence=None, readonly=False)
- ‘Individually’: scale each plot so that the peak value will be white and the minimum value black. ‘None’: no scaling - 0.0 will be black and 1.0 will be white. ‘AllTogether’: scale each plot so that the peak value of all the plots is white, and the minimum value of all the plots will be black. ‘JointProjections’: as ‘Individually’, except that plots produced from projections whose weights are jointly normalized will be jointly normalized. Normalization has the advantage of ensuring that any data that is present will be visible, but the disadvantage that the absolute scale will be obscured. Non-normalized plots are guaranteed to be on a known scale, but only values between 0.0 and 1.0 will be visibly distinguishable.
- param Boolean enforce_minimum_plot_height (allow_None=False, bounds=(0, 1), constant=False, default=True, instantiate=False, pickle_default_value=True, precedence=None, readonly=False)
- If true, ensure that plots are never shown smaller than their native size, i.e. with fewer than one pixel per matrix unit. This option is normally left on for safety, so that no visualization will be missing any units. However, it may be acceptable to turn this check off when working with matrix sizes much larger than your screen resolution.
- param ObjectSelector sheet (allow_None=None, check_on_set=False, constant=False, default=None, instantiate=False, objects=[], pickle_default_value=True, precedence=None, readonly=False)
- The Sheet from which to produce plots.
- param Number density (allow_None=False, bounds=None, constant=False, default=10.0, inclusive_bounds=(True, True), instantiate=False, pickle_default_value=True, precedence=None, readonly=False, time_dependent=True, time_fn=<Time Time00001>)
- Number of units to plot per 1.0 distance in sheet coordinates
- param List prerequisites (allow_None=False, bounds=(0, None), constant=False, default=[], instantiate=True, pickle_default_value=True, precedence=None, readonly=False)
- List of preference maps that must exist before this plot can be calculated.
- param String doc (allow_None=False, basestring=<type ‘basestring’>, constant=False, default=, instantiate=False, pickle_default_value=True, precedence=None, readonly=False)
- Documentation string describing this type of plot.
- param Boolean sheet_coords (allow_None=False, bounds=(0, 1), constant=False, default=False, instantiate=False, pickle_default_value=True, precedence=None, readonly=False)
- Whether to scale plots based on their relative sizes in sheet coordinates. If true, plots are scaled so that their sizes are proportional to their area in sheet coordinates, so that one can compare corresponding areas. If false, plots are scaled to have similar sizes on screen, regardless of their corresponding sheet areas, which maximizes the size of each plot.
- param ObjectSelector color_channel (allow_None=None, check_on_set=True, compute_default_fn=None, constant=False, default=None, instantiate=False, objects=[‘None’], pickle_default_value=True, precedence=None, readonly=False)
- Defines the color channel to be displayed in the GUI, can usually be set to a measured OrientationMap
- param Boolean auto_refresh (allow_None=False, bounds=(0, 1), constant=False, default=False, instantiate=False, pickle_default_value=True, precedence=None, readonly=False)
- If this plot is being displayed persistently (e.g. in a GUI), whether to regenerate it automatically whenever the simulation time advances. The default is False, because many plots are slow to generate (including most preference map plots).
- param Number desired_maximum_plot_height (allow_None=False, bounds=(0, None), constant=False, default=0, inclusive_bounds=(True, True), instantiate=False, pickle_default_value=True, precedence=None, readonly=False, time_dependent=True, time_fn=<Time Time00001>)
- User-specified height of the tallest plot in this PlotGroup. Other plots will generally be scaled as appropriate, either to match this size (when sheet_coords is False), or to have the appropriate relative size (when sheet_coords is True). If enforce_minimum_plot_height is True, the actual maximum plot height may be larger than this parameter’s value. In particular, with enforce_minimum_plot_height=True, the default value of 0 gives plots that are the size of the underlying matrix, which is the most efficient size for saving plots directly to disk. Larger values (e.g. 150) are suitable when displaying plots on screen.
- param HookList pre_plot_hooks (allow_None=False, bounds=(0, None), constant=False, default=[], instantiate=True, pickle_default_value=True, precedence=None, readonly=False)
- Commands to execute before updating this plot, e.g. to calculate sheet views. The commands can be any callable Python objects, i.e. any x for which x() is valid. The initial value is determined by the template for this plot, but various arguments can be passed, a modified version substituted, etc.
- param Boolean plot_immediately (allow_None=False, bounds=(0, 1), constant=False, default=False, instantiate=False, pickle_default_value=True, precedence=None, readonly=False)
- Whether to call the pre-plot hooks at once or only when the user asks for a refresh. Should be set to true for quick plots, but false for those that take a long time to calculate, so that the user can change the hooks if necessary.
- param HookList plot_hooks (allow_None=False, bounds=(0, None), constant=False, default=[], instantiate=True, pickle_default_value=True, precedence=None, readonly=False)
- Commands to execute when redrawing a plot rather than regenerating data. E.g, for a plot with data measured once but displayed one sheet or unit at at time, this command will be called whenever the sheet or coordinate of unit to be plotted (or the simulator time) has changed. The commands can be any callable Python objects, i.e. any x for which x() is valid. The initial value is determined by the template for this plot, but various arguments can be passed, a modified version substituted, etc.
- param Boolean integer_scaling (allow_None=False, bounds=(0, 1), constant=False, default=False, instantiate=False, pickle_default_value=True, precedence=None, readonly=False)
- When scaling bitmaps, whether to ensure that the scaled bitmap is an even multiple of the original. If true, every unit will be represented by a square of the same size. Typically false so that the overall area will be correct, e.g. when using Sheet coordinates, which is often more important.
- param String category (allow_None=False, basestring=<type ‘basestring’>, constant=False, default=User, instantiate=False, pickle_default_value=True, precedence=None, readonly=False)
- Category to which this plot belongs, which will be created if necessary.
- param Boolean situate (allow_None=False, bounds=(0, 1), constant=False, default=False, instantiate=False, pickle_default_value=True, precedence=None, readonly=False)
- If True, plots the weights on the entire source sheet, using zeros for all weights outside the ConnectionField. If False, plots only the actual weights that are stored.
- param Callable filterfn (allow_None=False, constant=False, instantiate=False, pickle_default_value=True, precedence=None, readonly=False)
- Boolean function allowing control over which items will be plotted. E.g.: filterfn=lambda x: x.name in [‘Retina’,’V1’] for a plot ranging over Sheets, or filterfn=lambda x: x[0]==x[1] for a plot ranging over coordinates.
- param ObjectSelector projection (allow_None=None, check_on_set=False, compute_default_fn=None, constant=False, default=None, instantiate=False, objects=[], pickle_default_value=True, precedence=None, readonly=False)
- The projection to visualize.
- add_static_image(name, file_path)
Construct a static image Plot (e.g. a color key for an Orientation Preference map).
- coords
Calculate the grid layout of the plots from their precedences and row_precedences. Returns a list of triples (row, col, plot).
- debug(msg, *args, **kw)
Print msg merged with args as a debugging statement.
See Python’s logging module for details of message formatting.
- defaults()
Return {parameter_name:parameter.default} for all non-constant Parameters.
Note that a Parameter for which instantiate==True has its default instantiated.
- force_new_dynamic_value = <functools.partial object at 0x2b07af1b0e68>
- generate_coords()
Evenly space out the units within the sheet bounding box, so that it doesn’t matter which corner the measurements start from. A 4 unit grid needs 5 segments. List is in left-to-right, from top-to-bottom.
- get_param_values(onlychanged=False)
Return a list of name,value pairs for all Parameters of this object.
If onlychanged is True, will only return values that are not equal to the default value.
- get_value_generator = <functools.partial object at 0x2b07af1b0fc8>
- grid
Return the plots in grid format, i.e., a list of rows, each of which is a list of plots. The rows are right padded with None as necessary.
- inspect_value = <functools.partial object at 0x2b07af5eb100>
- make_plots(update=True)
Create and scale the plots, after first executing the PlotGroup’s pre_plot_hooks (if update is True) and plot_hooks.
- message(msg, *args, **kw)
Print msg merged with args as a message.
See Python’s logging module for details of message formatting.
- classmethod params(parameter_name=None)
Return the Parameters of this class as the dictionary {name: parameter_object}
Includes Parameters from this class and its superclasses.
- pprint(imports=None, prefix=' ', unknown_value='<?>', qualify=False, separator='')
(Experimental) Pretty printed representation that may be evaluated with eval. See pprint() function for more details.
- classmethod print_param_defaults()
Print the default values of all cls’s Parameters.
- print_param_values()
Print the values of all this object’s Parameters.
- scale_images(zoom_factor=None)
Enlarge or reduce the bitmaps as needed for display.
The calculated sizes will be multiplied by the given zoom_factor, if it is not None.
If the scaled sizes would be outside of the allowed range, no scaling is done, and False is returned. (One might conceivably instead want the scaling to reach the actual minimum or maximum allowed, but if we did this, then repeated enlargements and reductions would not be reversible, unless we were very tricky about how we did it.)
- script_repr(imports=, []prefix=' ')
Variant of __repr__ designed for generating a runnable script.
- classmethod set_default(param_name, value)
Set the default value of param_name.
Equivalent to setting param_name on the class.
- set_dynamic_time_fn = <functools.partial object at 0x2b07af5eb520>
- set_param = <functools.partial object at 0x2b07af5eb578>
- sheet_type
alias of CFSheet
- state_pop()
Restore the most recently saved state.
See state_push() for more details.
- state_push()
Save this instance’s state.
For Parameterized instances, this includes the state of dynamically generated values.
Subclasses that maintain short-term state should additionally save and restore that state using state_push() and state_pop().
Generally, this method is used by operations that need to test something without permanently altering the objects’ state.
- update_maximum_plot_height(zoom_factor=None)
Determine which plot will be the largest, based on the settings for minimum plot heights, the specified zoom factor (if not None), etc.
A minimum size (and potentially a maximum size) are enforced, as described below.
If the scaled sizes would be outside of the allowed range, False is returned.
For matrix coordinate plots (sheet_coords=False), the minimum size is calculated as the native size of the largest bitmap to be plotted. Other plots are then usually scaled up to (but not greater than) this size, so that all plots are approximately the same size, and no plot is missing any pixel.
For Sheet coordinate plots, the minimum plotting density that will avoid losing pixels is determined by the maximum density from any sheet. If all plots are then drawn at that density (as they must be for them to be in Sheet coordinates), the largest plot will then be the one with the largest sheet bounds, and the size of that plot will be the maximum density times the largest sheet bounds.
- verbose(msg, *args, **kw)
Print msg merged with args as a verbose message.
See Python’s logging module for details of message formatting.
- warning(msg, *args, **kw)
Print msg merged with args as a warning, unless module variable warnings_as_exceptions is True, then raise an Exception containing the arguments.
See Python’s logging module for details of message formatting.
- class topo.plotting.plotgroup.ConnectionFieldsPlotGroup(plot_templates=None, static_images=None, **params)[source]
Bases: topo.plotting.plotgroup.UnitPlotGroup
Visualize ConnectionField for each of a CFSheet’s CFProjections.
- param ObjectSelector normalize (allow_None=None, check_on_set=True, compute_default_fn=None, constant=False, default=None, instantiate=False, objects=[‘None’, ‘Individually’, ‘AllTogether’, ‘JointProjections’], pickle_default_value=True, precedence=None, readonly=False)
- ‘Individually’: scale each plot so that the peak value will be white and the minimum value black. ‘None’: no scaling - 0.0 will be black and 1.0 will be white. ‘AllTogether’: scale each plot so that the peak value of all the plots is white, and the minimum value of all the plots will be black. ‘JointProjections’: as ‘Individually’, except that plots produced from projections whose weights are jointly normalized will be jointly normalized. Normalization has the advantage of ensuring that any data that is present will be visible, but the disadvantage that the absolute scale will be obscured. Non-normalized plots are guaranteed to be on a known scale, but only values between 0.0 and 1.0 will be visibly distinguishable.
- param Boolean enforce_minimum_plot_height (allow_None=False, bounds=(0, 1), constant=False, default=True, instantiate=False, pickle_default_value=True, precedence=None, readonly=False)
- If true, ensure that plots are never shown smaller than their native size, i.e. with fewer than one pixel per matrix unit. This option is normally left on for safety, so that no visualization will be missing any units. However, it may be acceptable to turn this check off when working with matrix sizes much larger than your screen resolution.
- param ObjectSelector sheet (allow_None=None, check_on_set=False, constant=False, default=None, instantiate=False, objects=[], pickle_default_value=True, precedence=None, readonly=False)
- The Sheet from which to produce plots.
- param List prerequisites (allow_None=False, bounds=(0, None), constant=False, default=[], instantiate=True, pickle_default_value=True, precedence=None, readonly=False)
- List of preference maps that must exist before this plot can be calculated.
- param String doc (allow_None=False, basestring=<type ‘basestring’>, constant=False, default=, instantiate=False, pickle_default_value=True, precedence=None, readonly=False)
- Documentation string describing this type of plot.
- param Boolean sheet_coords (allow_None=False, bounds=(0, 1), constant=False, default=False, instantiate=False, pickle_default_value=True, precedence=None, readonly=False)
- Whether to scale plots based on their relative sizes in sheet coordinates. If true, plots are scaled so that their sizes are proportional to their area in sheet coordinates, so that one can compare corresponding areas. If false, plots are scaled to have similar sizes on screen, regardless of their corresponding sheet areas, which maximizes the size of each plot.
- param ObjectSelector color_channel (allow_None=None, check_on_set=True, compute_default_fn=None, constant=False, default=None, instantiate=False, objects=[‘None’], pickle_default_value=True, precedence=None, readonly=False)
- Defines the color channel to be displayed in the GUI, can usually be set to a measured OrientationMap
- param Boolean auto_refresh (allow_None=False, bounds=(0, 1), constant=False, default=False, instantiate=False, pickle_default_value=True, precedence=None, readonly=False)
- If this plot is being displayed persistently (e.g. in a GUI), whether to regenerate it automatically whenever the simulation time advances. The default is False, because many plots are slow to generate (including most preference map plots).
- param Number desired_maximum_plot_height (allow_None=False, bounds=(0, None), constant=False, default=0, inclusive_bounds=(True, True), instantiate=False, pickle_default_value=True, precedence=None, readonly=False, time_dependent=True, time_fn=<Time Time00001>)
- User-specified height of the tallest plot in this PlotGroup. Other plots will generally be scaled as appropriate, either to match this size (when sheet_coords is False), or to have the appropriate relative size (when sheet_coords is True). If enforce_minimum_plot_height is True, the actual maximum plot height may be larger than this parameter’s value. In particular, with enforce_minimum_plot_height=True, the default value of 0 gives plots that are the size of the underlying matrix, which is the most efficient size for saving plots directly to disk. Larger values (e.g. 150) are suitable when displaying plots on screen.
- param HookList pre_plot_hooks (allow_None=False, bounds=(0, None), constant=False, default=[], instantiate=True, pickle_default_value=True, precedence=None, readonly=False)
- Commands to execute before updating this plot, e.g. to calculate sheet views. The commands can be any callable Python objects, i.e. any x for which x() is valid. The initial value is determined by the template for this plot, but various arguments can be passed, a modified version substituted, etc.
- param Boolean plot_immediately (allow_None=False, bounds=(0, 1), constant=False, default=False, instantiate=False, pickle_default_value=True, precedence=None, readonly=False)
- Whether to call the pre-plot hooks at once or only when the user asks for a refresh. Should be set to true for quick plots, but false for those that take a long time to calculate, so that the user can change the hooks if necessary.
- param HookList plot_hooks (allow_None=False, bounds=(0, None), constant=False, default=[], instantiate=True, pickle_default_value=True, precedence=None, readonly=False)
- Commands to execute when redrawing a plot rather than regenerating data. E.g, for a plot with data measured once but displayed one sheet or unit at at time, this command will be called whenever the sheet or coordinate of unit to be plotted (or the simulator time) has changed. The commands can be any callable Python objects, i.e. any x for which x() is valid. The initial value is determined by the template for this plot, but various arguments can be passed, a modified version substituted, etc.
- param Boolean integer_scaling (allow_None=False, bounds=(0, 1), constant=False, default=False, instantiate=False, pickle_default_value=True, precedence=None, readonly=False)
- When scaling bitmaps, whether to ensure that the scaled bitmap is an even multiple of the original. If true, every unit will be represented by a square of the same size. Typically false so that the overall area will be correct, e.g. when using Sheet coordinates, which is often more important.
- param Number y (allow_None=False, bounds=None, constant=False, default=0.0, inclusive_bounds=(True, True), instantiate=False, pickle_default_value=True, precedence=None, readonly=False, time_dependent=True, time_fn=<Time Time00001>)
- y-coordinate of the unit to plot
- param Number x (allow_None=False, bounds=None, constant=False, default=0.0, inclusive_bounds=(True, True), instantiate=False, pickle_default_value=True, precedence=None, readonly=False, time_dependent=True, time_fn=<Time Time00001>)
- x-coordinate of the unit to plot
- param String category (allow_None=False, basestring=<type ‘basestring’>, constant=False, default=User, instantiate=False, pickle_default_value=True, precedence=None, readonly=False)
- Category to which this plot belongs, which will be created if necessary.
- param Boolean situate (allow_None=False, bounds=(0, 1), constant=False, default=False, instantiate=False, pickle_default_value=True, precedence=None, readonly=False)
- If True, plots the weights on the entire source sheet, using zeros for all weights outside the ConnectionField. If False, plots only the actual weights that are stored.
- param Callable filterfn (allow_None=False, constant=False, instantiate=False, pickle_default_value=True, precedence=None, readonly=False)
- Boolean function allowing control over which items will be plotted. E.g.: filterfn=lambda x: x.name in [‘Retina’,’V1’] for a plot ranging over Sheets, or filterfn=lambda x: x[0]==x[1] for a plot ranging over coordinates.
- add_static_image(name, file_path)
Construct a static image Plot (e.g. a color key for an Orientation Preference map).
- coords
Calculate the grid layout of the plots from their precedences and row_precedences. Returns a list of triples (row, col, plot).
- debug(msg, *args, **kw)
Print msg merged with args as a debugging statement.
See Python’s logging module for details of message formatting.
- defaults()
Return {parameter_name:parameter.default} for all non-constant Parameters.
Note that a Parameter for which instantiate==True has its default instantiated.
- force_new_dynamic_value = <functools.partial object at 0x2b07af1b0ec0>
- get_param_values(onlychanged=False)
Return a list of name,value pairs for all Parameters of this object.
If onlychanged is True, will only return values that are not equal to the default value.
- get_value_generator = <functools.partial object at 0x2b07af1b0fc8>
- grid
Return the plots in grid format, i.e., a list of rows, each of which is a list of plots. The rows are right padded with None as necessary.
- inspect_value = <functools.partial object at 0x2b07af1b0f70>
- make_plots(update=True)
Create and scale the plots, after first executing the PlotGroup’s pre_plot_hooks (if update is True) and plot_hooks.
- message(msg, *args, **kw)
Print msg merged with args as a message.
See Python’s logging module for details of message formatting.
- classmethod params(parameter_name=None)
Return the Parameters of this class as the dictionary {name: parameter_object}
Includes Parameters from this class and its superclasses.
- pprint(imports=None, prefix=' ', unknown_value='<?>', qualify=False, separator='')
(Experimental) Pretty printed representation that may be evaluated with eval. See pprint() function for more details.
- classmethod print_param_defaults()
Print the default values of all cls’s Parameters.
- print_param_values()
Print the values of all this object’s Parameters.
- scale_images(zoom_factor=None)
Enlarge or reduce the bitmaps as needed for display.
The calculated sizes will be multiplied by the given zoom_factor, if it is not None.
If the scaled sizes would be outside of the allowed range, no scaling is done, and False is returned. (One might conceivably instead want the scaling to reach the actual minimum or maximum allowed, but if we did this, then repeated enlargements and reductions would not be reversible, unless we were very tricky about how we did it.)
- script_repr(imports=, []prefix=' ')
Variant of __repr__ designed for generating a runnable script.
- classmethod set_default(param_name, value)
Set the default value of param_name.
Equivalent to setting param_name on the class.
- set_dynamic_time_fn = <functools.partial object at 0x2b07af1b0d08>
- set_param = <functools.partial object at 0x2b07af1b0ba8>
- sheet_type
alias of CFSheet
- state_pop()
Restore the most recently saved state.
See state_push() for more details.
- state_push()
Save this instance’s state.
For Parameterized instances, this includes the state of dynamically generated values.
Subclasses that maintain short-term state should additionally save and restore that state using state_push() and state_pop().
Generally, this method is used by operations that need to test something without permanently altering the objects’ state.
- update_maximum_plot_height(zoom_factor=None)
Determine which plot will be the largest, based on the settings for minimum plot heights, the specified zoom factor (if not None), etc.
A minimum size (and potentially a maximum size) are enforced, as described below.
If the scaled sizes would be outside of the allowed range, False is returned.
For matrix coordinate plots (sheet_coords=False), the minimum size is calculated as the native size of the largest bitmap to be plotted. Other plots are then usually scaled up to (but not greater than) this size, so that all plots are approximately the same size, and no plot is missing any pixel.
For Sheet coordinate plots, the minimum plotting density that will avoid losing pixels is determined by the maximum density from any sheet. If all plots are then drawn at that density (as they must be for them to be in Sheet coordinates), the largest plot will then be the one with the largest sheet bounds, and the size of that plot will be the maximum density times the largest sheet bounds.
- verbose(msg, *args, **kw)
Print msg merged with args as a verbose message.
See Python’s logging module for details of message formatting.
- warning(msg, *args, **kw)
Print msg merged with args as a warning, unless module variable warnings_as_exceptions is True, then raise an Exception containing the arguments.
See Python’s logging module for details of message formatting.
- class topo.plotting.plotgroup.GridPlotGroup(plot_templates=None, static_images=None, **params)[source]
Bases: topo.plotting.plotgroup.ProjectionSheetPlotGroup
A ProjectionSheetPlotGroup capable of generating coordinates on a 2D grid.
- param ObjectSelector normalize (allow_None=None, check_on_set=True, compute_default_fn=None, constant=False, default=None, instantiate=False, objects=[‘None’, ‘Individually’, ‘AllTogether’], pickle_default_value=True, precedence=None, readonly=False)
- ‘Individually’: scale each plot so that the peak value will be white and the minimum value black. ‘None’: no scaling - 0.0 will be black and 1.0 will be white. ‘AllTogether’: scale each plot so that the peak value of all the plots is white, and the minimum value of all the plots will be black. ‘JointProjections’: as ‘Individually’, except that plots produced from projections whose weights are jointly normalized will be jointly normalized. Normalization has the advantage of ensuring that any data that is present will be visible, but the disadvantage that the absolute scale will be obscured. Non-normalized plots are guaranteed to be on a known scale, but only values between 0.0 and 1.0 will be visibly distinguishable.
- param Boolean enforce_minimum_plot_height (allow_None=False, bounds=(0, 1), constant=False, default=True, instantiate=False, pickle_default_value=True, precedence=None, readonly=False)
- If true, ensure that plots are never shown smaller than their native size, i.e. with fewer than one pixel per matrix unit. This option is normally left on for safety, so that no visualization will be missing any units. However, it may be acceptable to turn this check off when working with matrix sizes much larger than your screen resolution.
- param ObjectSelector sheet (allow_None=None, check_on_set=False, constant=False, default=None, instantiate=False, objects=[], pickle_default_value=True, precedence=None, readonly=False)
- The Sheet from which to produce plots.
- param Number density (allow_None=False, bounds=None, constant=False, default=10.0, inclusive_bounds=(True, True), instantiate=False, pickle_default_value=True, precedence=None, readonly=False, time_dependent=True, time_fn=<Time Time00001>)
- Number of units to plot per 1.0 distance in sheet coordinates
- param List prerequisites (allow_None=False, bounds=(0, None), constant=False, default=[], instantiate=True, pickle_default_value=True, precedence=None, readonly=False)
- List of preference maps that must exist before this plot can be calculated.
- param String doc (allow_None=False, basestring=<type ‘basestring’>, constant=False, default=, instantiate=False, pickle_default_value=True, precedence=None, readonly=False)
- Documentation string describing this type of plot.
- param Boolean sheet_coords (allow_None=False, bounds=(0, 1), constant=False, default=False, instantiate=False, pickle_default_value=True, precedence=None, readonly=False)
- Whether to scale plots based on their relative sizes in sheet coordinates. If true, plots are scaled so that their sizes are proportional to their area in sheet coordinates, so that one can compare corresponding areas. If false, plots are scaled to have similar sizes on screen, regardless of their corresponding sheet areas, which maximizes the size of each plot.
- param ObjectSelector color_channel (allow_None=None, check_on_set=True, compute_default_fn=None, constant=False, default=None, instantiate=False, objects=[‘None’], pickle_default_value=True, precedence=None, readonly=False)
- Defines the color channel to be displayed in the GUI, can usually be set to a measured OrientationMap
- param Boolean auto_refresh (allow_None=False, bounds=(0, 1), constant=False, default=False, instantiate=False, pickle_default_value=True, precedence=None, readonly=False)
- If this plot is being displayed persistently (e.g. in a GUI), whether to regenerate it automatically whenever the simulation time advances. The default is False, because many plots are slow to generate (including most preference map plots).
- param Number desired_maximum_plot_height (allow_None=False, bounds=(0, None), constant=False, default=0, inclusive_bounds=(True, True), instantiate=False, pickle_default_value=True, precedence=None, readonly=False, time_dependent=True, time_fn=<Time Time00001>)
- User-specified height of the tallest plot in this PlotGroup. Other plots will generally be scaled as appropriate, either to match this size (when sheet_coords is False), or to have the appropriate relative size (when sheet_coords is True). If enforce_minimum_plot_height is True, the actual maximum plot height may be larger than this parameter’s value. In particular, with enforce_minimum_plot_height=True, the default value of 0 gives plots that are the size of the underlying matrix, which is the most efficient size for saving plots directly to disk. Larger values (e.g. 150) are suitable when displaying plots on screen.
- param HookList pre_plot_hooks (allow_None=False, bounds=(0, None), constant=False, default=[], instantiate=True, pickle_default_value=True, precedence=None, readonly=False)
- Commands to execute before updating this plot, e.g. to calculate sheet views. The commands can be any callable Python objects, i.e. any x for which x() is valid. The initial value is determined by the template for this plot, but various arguments can be passed, a modified version substituted, etc.
- param Boolean plot_immediately (allow_None=False, bounds=(0, 1), constant=False, default=False, instantiate=False, pickle_default_value=True, precedence=None, readonly=False)
- Whether to call the pre-plot hooks at once or only when the user asks for a refresh. Should be set to true for quick plots, but false for those that take a long time to calculate, so that the user can change the hooks if necessary.
- param HookList plot_hooks (allow_None=False, bounds=(0, None), constant=False, default=[], instantiate=True, pickle_default_value=True, precedence=None, readonly=False)
- Commands to execute when redrawing a plot rather than regenerating data. E.g, for a plot with data measured once but displayed one sheet or unit at at time, this command will be called whenever the sheet or coordinate of unit to be plotted (or the simulator time) has changed. The commands can be any callable Python objects, i.e. any x for which x() is valid. The initial value is determined by the template for this plot, but various arguments can be passed, a modified version substituted, etc.
- param Boolean integer_scaling (allow_None=False, bounds=(0, 1), constant=False, default=False, instantiate=False, pickle_default_value=True, precedence=None, readonly=False)
- When scaling bitmaps, whether to ensure that the scaled bitmap is an even multiple of the original. If true, every unit will be represented by a square of the same size. Typically false so that the overall area will be correct, e.g. when using Sheet coordinates, which is often more important.
- param String category (allow_None=False, basestring=<type ‘basestring’>, constant=False, default=User, instantiate=False, pickle_default_value=True, precedence=None, readonly=False)
- Category to which this plot belongs, which will be created if necessary.
- param Callable filterfn (allow_None=False, constant=False, instantiate=False, pickle_default_value=True, precedence=None, readonly=False)
- Boolean function allowing control over which items will be plotted. E.g.: filterfn=lambda x: x.name in [‘Retina’,’V1’] for a plot ranging over Sheets, or filterfn=lambda x: x[0]==x[1] for a plot ranging over coordinates.
- add_static_image(name, file_path)
Construct a static image Plot (e.g. a color key for an Orientation Preference map).
- coords
Calculate the grid layout of the plots from their precedences and row_precedences. Returns a list of triples (row, col, plot).
- debug(msg, *args, **kw)
Print msg merged with args as a debugging statement.
See Python’s logging module for details of message formatting.
- defaults()
Return {parameter_name:parameter.default} for all non-constant Parameters.
Note that a Parameter for which instantiate==True has its default instantiated.
- force_new_dynamic_value = <functools.partial object at 0x2b07af1b0cb0>
- generate_coords()[source]
Evenly space out the units within the sheet bounding box, so that it doesn’t matter which corner the measurements start from. A 4 unit grid needs 5 segments. List is in left-to-right, from top-to-bottom.
- get_param_values(onlychanged=False)
Return a list of name,value pairs for all Parameters of this object.
If onlychanged is True, will only return values that are not equal to the default value.
- get_value_generator = <functools.partial object at 0x2b07af1b0d60>
- grid
Return the plots in grid format, i.e., a list of rows, each of which is a list of plots. The rows are right padded with None as necessary.
- inspect_value = <functools.partial object at 0x2b07af1b0e68>
- make_plots(update=True)
Create and scale the plots, after first executing the PlotGroup’s pre_plot_hooks (if update is True) and plot_hooks.
- message(msg, *args, **kw)
Print msg merged with args as a message.
See Python’s logging module for details of message formatting.
- classmethod params(parameter_name=None)
Return the Parameters of this class as the dictionary {name: parameter_object}
Includes Parameters from this class and its superclasses.
- pprint(imports=None, prefix=' ', unknown_value='<?>', qualify=False, separator='')
(Experimental) Pretty printed representation that may be evaluated with eval. See pprint() function for more details.
- classmethod print_param_defaults()
Print the default values of all cls’s Parameters.
- print_param_values()
Print the values of all this object’s Parameters.
- scale_images(zoom_factor=None)
Enlarge or reduce the bitmaps as needed for display.
The calculated sizes will be multiplied by the given zoom_factor, if it is not None.
If the scaled sizes would be outside of the allowed range, no scaling is done, and False is returned. (One might conceivably instead want the scaling to reach the actual minimum or maximum allowed, but if we did this, then repeated enlargements and reductions would not be reversible, unless we were very tricky about how we did it.)
- script_repr(imports=, []prefix=' ')
Variant of __repr__ designed for generating a runnable script.
- classmethod set_default(param_name, value)
Set the default value of param_name.
Equivalent to setting param_name on the class.
- set_dynamic_time_fn = <functools.partial object at 0x2b07af1b0b50>
- set_param = <functools.partial object at 0x2b07af1b0c00>
- sheet_type
alias of ProjectionSheet
- state_pop()
Restore the most recently saved state.
See state_push() for more details.
- state_push()
Save this instance’s state.
For Parameterized instances, this includes the state of dynamically generated values.
Subclasses that maintain short-term state should additionally save and restore that state using state_push() and state_pop().
Generally, this method is used by operations that need to test something without permanently altering the objects’ state.
- update_maximum_plot_height(zoom_factor=None)
Determine which plot will be the largest, based on the settings for minimum plot heights, the specified zoom factor (if not None), etc.
A minimum size (and potentially a maximum size) are enforced, as described below.
If the scaled sizes would be outside of the allowed range, False is returned.
For matrix coordinate plots (sheet_coords=False), the minimum size is calculated as the native size of the largest bitmap to be plotted. Other plots are then usually scaled up to (but not greater than) this size, so that all plots are approximately the same size, and no plot is missing any pixel.
For Sheet coordinate plots, the minimum plotting density that will avoid losing pixels is determined by the maximum density from any sheet. If all plots are then drawn at that density (as they must be for them to be in Sheet coordinates), the largest plot will then be the one with the largest sheet bounds, and the size of that plot will be the maximum density times the largest sheet bounds.
- verbose(msg, *args, **kw)
Print msg merged with args as a verbose message.
See Python’s logging module for details of message formatting.
- warning(msg, *args, **kw)
Print msg merged with args as a warning, unless module variable warnings_as_exceptions is True, then raise an Exception containing the arguments.
See Python’s logging module for details of message formatting.
- class topo.plotting.plotgroup.PlotGroup(**params)[source]
Bases: param.parameterized.Parameterized
Container that has one or more Plots and also knows how to arrange the plots and other special parameters.
- param HookList pre_plot_hooks (allow_None=False, bounds=(0, None), constant=False, default=[], instantiate=True, pickle_default_value=True, precedence=None, readonly=False)
- Commands to execute before updating this plot, e.g. to calculate sheet views. The commands can be any callable Python objects, i.e. any x for which x() is valid. The initial value is determined by the template for this plot, but various arguments can be passed, a modified version substituted, etc.
- param HookList plot_hooks (allow_None=False, bounds=(0, None), constant=False, default=[], instantiate=True, pickle_default_value=True, precedence=None, readonly=False)
- Commands to execute when redrawing a plot rather than regenerating data. E.g, for a plot with data measured once but displayed one sheet or unit at at time, this command will be called whenever the sheet or coordinate of unit to be plotted (or the simulator time) has changed. The commands can be any callable Python objects, i.e. any x for which x() is valid. The initial value is determined by the template for this plot, but various arguments can be passed, a modified version substituted, etc.
- coords[source]
Calculate the grid layout of the plots from their precedences and row_precedences. Returns a list of triples (row, col, plot).
- debug(msg, *args, **kw)
Print msg merged with args as a debugging statement.
See Python’s logging module for details of message formatting.
- defaults()
Return {parameter_name:parameter.default} for all non-constant Parameters.
Note that a Parameter for which instantiate==True has its default instantiated.
- force_new_dynamic_value = <functools.partial object at 0x2b07af1b0fc8>
- get_param_values(onlychanged=False)
Return a list of name,value pairs for all Parameters of this object.
If onlychanged is True, will only return values that are not equal to the default value.
- get_value_generator = <functools.partial object at 0x2b07af1b0cb0>
- grid[source]
Return the plots in grid format, i.e., a list of rows, each of which is a list of plots. The rows are right padded with None as necessary.
- inspect_value = <functools.partial object at 0x2b07af1b0d08>
- make_plots(update=True)[source]
Create and scale the plots, after first executing the PlotGroup’s pre_plot_hooks (if update is True) and plot_hooks.
- message(msg, *args, **kw)
Print msg merged with args as a message.
See Python’s logging module for details of message formatting.
- classmethod params(parameter_name=None)
Return the Parameters of this class as the dictionary {name: parameter_object}
Includes Parameters from this class and its superclasses.
- pprint(imports=None, prefix=' ', unknown_value='<?>', qualify=False, separator='')
(Experimental) Pretty printed representation that may be evaluated with eval. See pprint() function for more details.
- classmethod print_param_defaults()
Print the default values of all cls’s Parameters.
- print_param_values()
Print the values of all this object’s Parameters.
- scale_images(zoom_factor=None)[source]
Scale the images by the given zoom factor, if appropriate; default is to do nothing.
- script_repr(imports=, []prefix=' ')
Variant of __repr__ designed for generating a runnable script.
- classmethod set_default(param_name, value)
Set the default value of param_name.
Equivalent to setting param_name on the class.
- set_dynamic_time_fn = <functools.partial object at 0x2b07af1b0f18>
- set_param = <functools.partial object at 0x2b07af1b0db8>
- state_pop()
Restore the most recently saved state.
See state_push() for more details.
- state_push()
Save this instance’s state.
For Parameterized instances, this includes the state of dynamically generated values.
Subclasses that maintain short-term state should additionally save and restore that state using state_push() and state_pop().
Generally, this method is used by operations that need to test something without permanently altering the objects’ state.
- verbose(msg, *args, **kw)
Print msg merged with args as a verbose message.
See Python’s logging module for details of message formatting.
- warning(msg, *args, **kw)
Print msg merged with args as a warning, unless module variable warnings_as_exceptions is True, then raise an Exception containing the arguments.
See Python’s logging module for details of message formatting.
- class topo.plotting.plotgroup.ProjectionActivityPlotGroup(plot_templates=None, static_images=None, **params)[source]
Bases: topo.plotting.plotgroup.ProjectionSheetPlotGroup
Visualize the activity of all Projections into a ProjectionSheet.
- param ObjectSelector normalize (allow_None=None, check_on_set=True, compute_default_fn=None, constant=False, default=None, instantiate=False, objects=[‘None’, ‘Individually’, ‘AllTogether’, ‘JointProjections’], pickle_default_value=True, precedence=None, readonly=False)
- ‘Individually’: scale each plot so that the peak value will be white and the minimum value black. ‘None’: no scaling - 0.0 will be black and 1.0 will be white. ‘AllTogether’: scale each plot so that the peak value of all the plots is white, and the minimum value of all the plots will be black. ‘JointProjections’: as ‘Individually’, except that plots produced from projections whose weights are jointly normalized will be jointly normalized. Normalization has the advantage of ensuring that any data that is present will be visible, but the disadvantage that the absolute scale will be obscured. Non-normalized plots are guaranteed to be on a known scale, but only values between 0.0 and 1.0 will be visibly distinguishable.
- param Boolean enforce_minimum_plot_height (allow_None=False, bounds=(0, 1), constant=False, default=True, instantiate=False, pickle_default_value=True, precedence=None, readonly=False)
- If true, ensure that plots are never shown smaller than their native size, i.e. with fewer than one pixel per matrix unit. This option is normally left on for safety, so that no visualization will be missing any units. However, it may be acceptable to turn this check off when working with matrix sizes much larger than your screen resolution.
- param ObjectSelector sheet (allow_None=None, check_on_set=False, constant=False, default=None, instantiate=False, objects=[], pickle_default_value=True, precedence=None, readonly=False)
- The Sheet from which to produce plots.
- param List prerequisites (allow_None=False, bounds=(0, None), constant=False, default=[], instantiate=True, pickle_default_value=True, precedence=None, readonly=False)
- List of preference maps that must exist before this plot can be calculated.
- param String doc (allow_None=False, basestring=<type ‘basestring’>, constant=False, default=, instantiate=False, pickle_default_value=True, precedence=None, readonly=False)
- Documentation string describing this type of plot.
- param Boolean sheet_coords (allow_None=False, bounds=(0, 1), constant=False, default=False, instantiate=False, pickle_default_value=True, precedence=None, readonly=False)
- Whether to scale plots based on their relative sizes in sheet coordinates. If true, plots are scaled so that their sizes are proportional to their area in sheet coordinates, so that one can compare corresponding areas. If false, plots are scaled to have similar sizes on screen, regardless of their corresponding sheet areas, which maximizes the size of each plot.
- param ObjectSelector color_channel (allow_None=None, check_on_set=True, compute_default_fn=None, constant=False, default=None, instantiate=False, objects=[‘None’], pickle_default_value=True, precedence=None, readonly=False)
- Defines the color channel to be displayed in the GUI, can usually be set to a measured OrientationMap
- param Boolean auto_refresh (allow_None=False, bounds=(0, 1), constant=False, default=False, instantiate=False, pickle_default_value=True, precedence=None, readonly=False)
- If this plot is being displayed persistently (e.g. in a GUI), whether to regenerate it automatically whenever the simulation time advances. The default is False, because many plots are slow to generate (including most preference map plots).
- param Number desired_maximum_plot_height (allow_None=False, bounds=(0, None), constant=False, default=0, inclusive_bounds=(True, True), instantiate=False, pickle_default_value=True, precedence=None, readonly=False, time_dependent=True, time_fn=<Time Time00001>)
- User-specified height of the tallest plot in this PlotGroup. Other plots will generally be scaled as appropriate, either to match this size (when sheet_coords is False), or to have the appropriate relative size (when sheet_coords is True). If enforce_minimum_plot_height is True, the actual maximum plot height may be larger than this parameter’s value. In particular, with enforce_minimum_plot_height=True, the default value of 0 gives plots that are the size of the underlying matrix, which is the most efficient size for saving plots directly to disk. Larger values (e.g. 150) are suitable when displaying plots on screen.
- param HookList pre_plot_hooks (allow_None=False, bounds=(0, None), constant=False, default=[], instantiate=True, pickle_default_value=True, precedence=None, readonly=False)
- Commands to execute before updating this plot, e.g. to calculate sheet views. The commands can be any callable Python objects, i.e. any x for which x() is valid. The initial value is determined by the template for this plot, but various arguments can be passed, a modified version substituted, etc.
- param Boolean plot_immediately (allow_None=False, bounds=(0, 1), constant=False, default=False, instantiate=False, pickle_default_value=True, precedence=None, readonly=False)
- Whether to call the pre-plot hooks at once or only when the user asks for a refresh. Should be set to true for quick plots, but false for those that take a long time to calculate, so that the user can change the hooks if necessary.
- param HookList plot_hooks (allow_None=False, bounds=(0, None), constant=False, default=[], instantiate=True, pickle_default_value=True, precedence=None, readonly=False)
- Commands to execute when redrawing a plot rather than regenerating data. E.g, for a plot with data measured once but displayed one sheet or unit at at time, this command will be called whenever the sheet or coordinate of unit to be plotted (or the simulator time) has changed. The commands can be any callable Python objects, i.e. any x for which x() is valid. The initial value is determined by the template for this plot, but various arguments can be passed, a modified version substituted, etc.
- param Boolean integer_scaling (allow_None=False, bounds=(0, 1), constant=False, default=False, instantiate=False, pickle_default_value=True, precedence=None, readonly=False)
- When scaling bitmaps, whether to ensure that the scaled bitmap is an even multiple of the original. If true, every unit will be represented by a square of the same size. Typically false so that the overall area will be correct, e.g. when using Sheet coordinates, which is often more important.
- param String category (allow_None=False, basestring=<type ‘basestring’>, constant=False, default=User, instantiate=False, pickle_default_value=True, precedence=None, readonly=False)
- Category to which this plot belongs, which will be created if necessary.
- param Callable filterfn (allow_None=False, constant=False, instantiate=False, pickle_default_value=True, precedence=None, readonly=False)
- Boolean function allowing control over which items will be plotted. E.g.: filterfn=lambda x: x.name in [‘Retina’,’V1’] for a plot ranging over Sheets, or filterfn=lambda x: x[0]==x[1] for a plot ranging over coordinates.
- add_static_image(name, file_path)
Construct a static image Plot (e.g. a color key for an Orientation Preference map).
- coords
Calculate the grid layout of the plots from their precedences and row_precedences. Returns a list of triples (row, col, plot).
- debug(msg, *args, **kw)
Print msg merged with args as a debugging statement.
See Python’s logging module for details of message formatting.
- defaults()
Return {parameter_name:parameter.default} for all non-constant Parameters.
Note that a Parameter for which instantiate==True has its default instantiated.
- force_new_dynamic_value = <functools.partial object at 0x2b07af1b0e68>
- get_param_values(onlychanged=False)
Return a list of name,value pairs for all Parameters of this object.
If onlychanged is True, will only return values that are not equal to the default value.
- get_value_generator = <functools.partial object at 0x2b07af1b0aa0>
- grid
Return the plots in grid format, i.e., a list of rows, each of which is a list of plots. The rows are right padded with None as necessary.
- inspect_value = <functools.partial object at 0x2b07af1b0c00>
- make_plots(update=True)
Create and scale the plots, after first executing the PlotGroup’s pre_plot_hooks (if update is True) and plot_hooks.
- message(msg, *args, **kw)
Print msg merged with args as a message.
See Python’s logging module for details of message formatting.
- classmethod params(parameter_name=None)
Return the Parameters of this class as the dictionary {name: parameter_object}
Includes Parameters from this class and its superclasses.
- pprint(imports=None, prefix=' ', unknown_value='<?>', qualify=False, separator='')
(Experimental) Pretty printed representation that may be evaluated with eval. See pprint() function for more details.
- classmethod print_param_defaults()
Print the default values of all cls’s Parameters.
- print_param_values()
Print the values of all this object’s Parameters.
- scale_images(zoom_factor=None)
Enlarge or reduce the bitmaps as needed for display.
The calculated sizes will be multiplied by the given zoom_factor, if it is not None.
If the scaled sizes would be outside of the allowed range, no scaling is done, and False is returned. (One might conceivably instead want the scaling to reach the actual minimum or maximum allowed, but if we did this, then repeated enlargements and reductions would not be reversible, unless we were very tricky about how we did it.)
- script_repr(imports=, []prefix=' ')
Variant of __repr__ designed for generating a runnable script.
- classmethod set_default(param_name, value)
Set the default value of param_name.
Equivalent to setting param_name on the class.
- set_dynamic_time_fn = <functools.partial object at 0x2b07af1b0b50>
- set_param = <functools.partial object at 0x2b07af1b0a48>
- sheet_type
alias of ProjectionSheet
- state_pop()
Restore the most recently saved state.
See state_push() for more details.
- state_push()
Save this instance’s state.
For Parameterized instances, this includes the state of dynamically generated values.
Subclasses that maintain short-term state should additionally save and restore that state using state_push() and state_pop().
Generally, this method is used by operations that need to test something without permanently altering the objects’ state.
- update_maximum_plot_height(zoom_factor=None)
Determine which plot will be the largest, based on the settings for minimum plot heights, the specified zoom factor (if not None), etc.
A minimum size (and potentially a maximum size) are enforced, as described below.
If the scaled sizes would be outside of the allowed range, False is returned.
For matrix coordinate plots (sheet_coords=False), the minimum size is calculated as the native size of the largest bitmap to be plotted. Other plots are then usually scaled up to (but not greater than) this size, so that all plots are approximately the same size, and no plot is missing any pixel.
For Sheet coordinate plots, the minimum plotting density that will avoid losing pixels is determined by the maximum density from any sheet. If all plots are then drawn at that density (as they must be for them to be in Sheet coordinates), the largest plot will then be the one with the largest sheet bounds, and the size of that plot will be the maximum density times the largest sheet bounds.
- verbose(msg, *args, **kw)
Print msg merged with args as a verbose message.
See Python’s logging module for details of message formatting.
- warning(msg, *args, **kw)
Print msg merged with args as a warning, unless module variable warnings_as_exceptions is True, then raise an Exception containing the arguments.
See Python’s logging module for details of message formatting.
- class topo.plotting.plotgroup.ProjectionSheetPlotGroup(plot_templates=None, static_images=None, **params)[source]
Bases: topo.plotting.plotgroup.TemplatePlotGroup
Abstract PlotGroup for visualizations of the Projections of one ProjectionSheet.
- param ObjectSelector normalize (allow_None=None, check_on_set=True, compute_default_fn=None, constant=False, default=None, instantiate=False, objects=[‘None’, ‘Individually’, ‘AllTogether’, ‘JointProjections’], pickle_default_value=True, precedence=None, readonly=False)
- ‘Individually’: scale each plot so that the peak value will be white and the minimum value black. ‘None’: no scaling - 0.0 will be black and 1.0 will be white. ‘AllTogether’: scale each plot so that the peak value of all the plots is white, and the minimum value of all the plots will be black. ‘JointProjections’: as ‘Individually’, except that plots produced from projections whose weights are jointly normalized will be jointly normalized. Normalization has the advantage of ensuring that any data that is present will be visible, but the disadvantage that the absolute scale will be obscured. Non-normalized plots are guaranteed to be on a known scale, but only values between 0.0 and 1.0 will be visibly distinguishable.
- param Boolean enforce_minimum_plot_height (allow_None=False, bounds=(0, 1), constant=False, default=True, instantiate=False, pickle_default_value=True, precedence=None, readonly=False)
- If true, ensure that plots are never shown smaller than their native size, i.e. with fewer than one pixel per matrix unit. This option is normally left on for safety, so that no visualization will be missing any units. However, it may be acceptable to turn this check off when working with matrix sizes much larger than your screen resolution.
- param ObjectSelector sheet (allow_None=None, check_on_set=False, constant=False, default=None, instantiate=False, objects=[], pickle_default_value=True, precedence=None, readonly=False)
- The Sheet from which to produce plots.
- param List prerequisites (allow_None=False, bounds=(0, None), constant=False, default=[], instantiate=True, pickle_default_value=True, precedence=None, readonly=False)
- List of preference maps that must exist before this plot can be calculated.
- param String doc (allow_None=False, basestring=<type ‘basestring’>, constant=False, default=, instantiate=False, pickle_default_value=True, precedence=None, readonly=False)
- Documentation string describing this type of plot.
- param Boolean sheet_coords (allow_None=False, bounds=(0, 1), constant=False, default=False, instantiate=False, pickle_default_value=True, precedence=None, readonly=False)
- Whether to scale plots based on their relative sizes in sheet coordinates. If true, plots are scaled so that their sizes are proportional to their area in sheet coordinates, so that one can compare corresponding areas. If false, plots are scaled to have similar sizes on screen, regardless of their corresponding sheet areas, which maximizes the size of each plot.
- param ObjectSelector color_channel (allow_None=None, check_on_set=True, compute_default_fn=None, constant=False, default=None, instantiate=False, objects=[‘None’], pickle_default_value=True, precedence=None, readonly=False)
- Defines the color channel to be displayed in the GUI, can usually be set to a measured OrientationMap
- param Boolean auto_refresh (allow_None=False, bounds=(0, 1), constant=False, default=False, instantiate=False, pickle_default_value=True, precedence=None, readonly=False)
- If this plot is being displayed persistently (e.g. in a GUI), whether to regenerate it automatically whenever the simulation time advances. The default is False, because many plots are slow to generate (including most preference map plots).
- param Number desired_maximum_plot_height (allow_None=False, bounds=(0, None), constant=False, default=0, inclusive_bounds=(True, True), instantiate=False, pickle_default_value=True, precedence=None, readonly=False, time_dependent=True, time_fn=<Time Time00001>)
- User-specified height of the tallest plot in this PlotGroup. Other plots will generally be scaled as appropriate, either to match this size (when sheet_coords is False), or to have the appropriate relative size (when sheet_coords is True). If enforce_minimum_plot_height is True, the actual maximum plot height may be larger than this parameter’s value. In particular, with enforce_minimum_plot_height=True, the default value of 0 gives plots that are the size of the underlying matrix, which is the most efficient size for saving plots directly to disk. Larger values (e.g. 150) are suitable when displaying plots on screen.
- param HookList pre_plot_hooks (allow_None=False, bounds=(0, None), constant=False, default=[], instantiate=True, pickle_default_value=True, precedence=None, readonly=False)
- Commands to execute before updating this plot, e.g. to calculate sheet views. The commands can be any callable Python objects, i.e. any x for which x() is valid. The initial value is determined by the template for this plot, but various arguments can be passed, a modified version substituted, etc.
- param Boolean plot_immediately (allow_None=False, bounds=(0, 1), constant=False, default=False, instantiate=False, pickle_default_value=True, precedence=None, readonly=False)
- Whether to call the pre-plot hooks at once or only when the user asks for a refresh. Should be set to true for quick plots, but false for those that take a long time to calculate, so that the user can change the hooks if necessary.
- param HookList plot_hooks (allow_None=False, bounds=(0, None), constant=False, default=[], instantiate=True, pickle_default_value=True, precedence=None, readonly=False)
- Commands to execute when redrawing a plot rather than regenerating data. E.g, for a plot with data measured once but displayed one sheet or unit at at time, this command will be called whenever the sheet or coordinate of unit to be plotted (or the simulator time) has changed. The commands can be any callable Python objects, i.e. any x for which x() is valid. The initial value is determined by the template for this plot, but various arguments can be passed, a modified version substituted, etc.
- param Boolean integer_scaling (allow_None=False, bounds=(0, 1), constant=False, default=False, instantiate=False, pickle_default_value=True, precedence=None, readonly=False)
- When scaling bitmaps, whether to ensure that the scaled bitmap is an even multiple of the original. If true, every unit will be represented by a square of the same size. Typically false so that the overall area will be correct, e.g. when using Sheet coordinates, which is often more important.
- param String category (allow_None=False, basestring=<type ‘basestring’>, constant=False, default=User, instantiate=False, pickle_default_value=True, precedence=None, readonly=False)
- Category to which this plot belongs, which will be created if necessary.
- param Callable filterfn (allow_None=False, constant=False, instantiate=False, pickle_default_value=True, precedence=None, readonly=False)
- Boolean function allowing control over which items will be plotted. E.g.: filterfn=lambda x: x.name in [‘Retina’,’V1’] for a plot ranging over Sheets, or filterfn=lambda x: x[0]==x[1] for a plot ranging over coordinates.
- add_static_image(name, file_path)
Construct a static image Plot (e.g. a color key for an Orientation Preference map).
- coords
Calculate the grid layout of the plots from their precedences and row_precedences. Returns a list of triples (row, col, plot).
- debug(msg, *args, **kw)
Print msg merged with args as a debugging statement.
See Python’s logging module for details of message formatting.
- defaults()
Return {parameter_name:parameter.default} for all non-constant Parameters.
Note that a Parameter for which instantiate==True has its default instantiated.
- force_new_dynamic_value = <functools.partial object at 0x2b07af1b0e10>
- get_param_values(onlychanged=False)
Return a list of name,value pairs for all Parameters of this object.
If onlychanged is True, will only return values that are not equal to the default value.
- get_value_generator = <functools.partial object at 0x2b07af1b0f18>
- grid
Return the plots in grid format, i.e., a list of rows, each of which is a list of plots. The rows are right padded with None as necessary.
- inspect_value = <functools.partial object at 0x2b07af1b0db8>
- make_plots(update=True)
Create and scale the plots, after first executing the PlotGroup’s pre_plot_hooks (if update is True) and plot_hooks.
- message(msg, *args, **kw)
Print msg merged with args as a message.
See Python’s logging module for details of message formatting.
- classmethod params(parameter_name=None)
Return the Parameters of this class as the dictionary {name: parameter_object}
Includes Parameters from this class and its superclasses.
- pprint(imports=None, prefix=' ', unknown_value='<?>', qualify=False, separator='')
(Experimental) Pretty printed representation that may be evaluated with eval. See pprint() function for more details.
- classmethod print_param_defaults()
Print the default values of all cls’s Parameters.
- print_param_values()
Print the values of all this object’s Parameters.
- scale_images(zoom_factor=None)
Enlarge or reduce the bitmaps as needed for display.
The calculated sizes will be multiplied by the given zoom_factor, if it is not None.
If the scaled sizes would be outside of the allowed range, no scaling is done, and False is returned. (One might conceivably instead want the scaling to reach the actual minimum or maximum allowed, but if we did this, then repeated enlargements and reductions would not be reversible, unless we were very tricky about how we did it.)
- script_repr(imports=, []prefix=' ')
Variant of __repr__ designed for generating a runnable script.
- classmethod set_default(param_name, value)
Set the default value of param_name.
Equivalent to setting param_name on the class.
- set_dynamic_time_fn = <functools.partial object at 0x2b07af1b0cb0>
- set_param = <functools.partial object at 0x2b07af1b0c58>
- sheet_type
alias of ProjectionSheet
- state_pop()
Restore the most recently saved state.
See state_push() for more details.
- state_push()
Save this instance’s state.
For Parameterized instances, this includes the state of dynamically generated values.
Subclasses that maintain short-term state should additionally save and restore that state using state_push() and state_pop().
Generally, this method is used by operations that need to test something without permanently altering the objects’ state.
- update_maximum_plot_height(zoom_factor=None)
Determine which plot will be the largest, based on the settings for minimum plot heights, the specified zoom factor (if not None), etc.
A minimum size (and potentially a maximum size) are enforced, as described below.
If the scaled sizes would be outside of the allowed range, False is returned.
For matrix coordinate plots (sheet_coords=False), the minimum size is calculated as the native size of the largest bitmap to be plotted. Other plots are then usually scaled up to (but not greater than) this size, so that all plots are approximately the same size, and no plot is missing any pixel.
For Sheet coordinate plots, the minimum plotting density that will avoid losing pixels is determined by the maximum density from any sheet. If all plots are then drawn at that density (as they must be for them to be in Sheet coordinates), the largest plot will then be the one with the largest sheet bounds, and the size of that plot will be the maximum density times the largest sheet bounds.
- verbose(msg, *args, **kw)
Print msg merged with args as a verbose message.
See Python’s logging module for details of message formatting.
- warning(msg, *args, **kw)
Print msg merged with args as a warning, unless module variable warnings_as_exceptions is True, then raise an Exception containing the arguments.
See Python’s logging module for details of message formatting.
- class topo.plotting.plotgroup.Subplotting(**params)[source]
Bases: param.parameterized.Parameterized
Convenience functions for handling subplots (such as colorized Activity plots). Only needed for avoiding typing, as plots can be declared with their own specific subplots without using these functions.
- param List plotgroups_to_subplot (allow_None=False, bounds=(0, None), constant=False, default=[‘Activity’, ‘Connection Fields’, ‘Projection’, ‘Projection Activity’], instantiate=True, pickle_default_value=True, precedence=None, readonly=False)
- List of plotgroups for which to set subplots.
- param Boolean subplotting_declared (allow_None=False, bounds=(0, 1), constant=False, default=False, instantiate=False, pickle_default_value=True, precedence=None, readonly=False)
- Whether set_subplots has previously been called
param Parameter _last_args (allow_None=False, constant=False, default=(), instantiate=False, pickle_default_value=True, precedence=None, readonly=False)
- debug(msg, *args, **kw)
Print msg merged with args as a debugging statement.
See Python’s logging module for details of message formatting.
- defaults()
Return {parameter_name:parameter.default} for all non-constant Parameters.
Note that a Parameter for which instantiate==True has its default instantiated.
- force_new_dynamic_value = <functools.partial object at 0x2b07af1b0aa0>
- get_param_values(onlychanged=False)
Return a list of name,value pairs for all Parameters of this object.
If onlychanged is True, will only return values that are not equal to the default value.
- get_value_generator = <functools.partial object at 0x2b07af1b0c58>
- inspect_value = <functools.partial object at 0x2b07af1b0fc8>
- message(msg, *args, **kw)
Print msg merged with args as a message.
See Python’s logging module for details of message formatting.
- classmethod params(parameter_name=None)
Return the Parameters of this class as the dictionary {name: parameter_object}
Includes Parameters from this class and its superclasses.
- pprint(imports=None, prefix=' ', unknown_value='<?>', qualify=False, separator='')
(Experimental) Pretty printed representation that may be evaluated with eval. See pprint() function for more details.
- classmethod print_param_defaults()
Print the default values of all cls’s Parameters.
- print_param_values()
Print the values of all this object’s Parameters.
- script_repr(imports=, []prefix=' ')
Variant of __repr__ designed for generating a runnable script.
- classmethod set_default(param_name, value)
Set the default value of param_name.
Equivalent to setting param_name on the class.
- set_dynamic_time_fn = <functools.partial object at 0x2b07af1b0c00>
- set_param = <functools.partial object at 0x2b07af1b0d60>
- static set_subplots(prefix=None, hue='', confidence='', force=True)[source]
Define Hue and Confidence subplots for each of the plotgroups_to_subplot. Typically used to make activity or weight plots show a preference value as the hue, and a selectivity as the confidence.
The specified hue, if any, should be the name of a Image, such as OrientationPreference. The specified confidence, if any, should be the name of a (usually) different Image, such as OrientationSelectivity.
The prefix option is a shortcut making the usual case easier to type; it sets hue to prefix+”Preference” and confidence to prefix+”Selectivity”.
If force=False, subplots are changed only if no subplot is currently defined. Force=False is useful for setting up subplots automatically when maps are measured, without overwriting any subplots set up specifically by the user.
Currently works only for plotgroups that have a plot with the same name as the plotgroup, though this could be changed easily.
Examples:
Subplotting.set_subplots("Orientation")
  - Set the default subplots to OrientationPreference and
  OrientationSelectivity

Subplotting.set_subplots(hue="OrientationPreference")
  - Set the default hue subplot to OrientationPreference with no
  selectivity

Subplotting.set_subplots()
  - Remove subplots from all the plotgroups_to_subplot.
- state_pop()
Restore the most recently saved state.
See state_push() for more details.
- state_push()
Save this instance’s state.
For Parameterized instances, this includes the state of dynamically generated values.
Subclasses that maintain short-term state should additionally save and restore that state using state_push() and state_pop().
Generally, this method is used by operations that need to test something without permanently altering the objects’ state.
- verbose(msg, *args, **kw)
Print msg merged with args as a verbose message.
See Python’s logging module for details of message formatting.
- warning(msg, *args, **kw)
Print msg merged with args as a warning, unless module variable warnings_as_exceptions is True, then raise an Exception containing the arguments.
See Python’s logging module for details of message formatting.
- class topo.plotting.plotgroup.TemplatePlotGroup(plot_templates=None, static_images=None, **params)[source]
Bases: topo.plotting.plotgroup.SheetPlotGroup
Container that allows creation of different types of plots in a way that is independent of particular models or Sheets.
A TemplatePlotGroup is constructed from a plot_templates list, an optional command to run to generate the data, and other optional parameters.
The plot_templates list should contain tuples (plot_name, plot_template). Each plot_template is a list of (name, value) pairs, where each name specifies a plotting channel (such as Hue or Confidence), and the value is the name of a Image (such as Activity or OrientationPreference).
Various types of plots support different channels. An SHC plot supports Strength, Hue, and Confidence channels (with Strength usually being visualized as luminance, Hue as a color value, and Confidence as the saturation of the color). An RGB plot supports Red, Green, and Blue channels. Other plot types will be added eventually.
For instance, one could define an Orientation-colored Activity plot as:
plotgroups['Activity'] =
    TemplatePlotGroup(name='Activity', category='Basic',
        pre_plot_hooks=[measure_activity],
        plot_templates=[('Activity',
            {'Strength': 'Activity', 'Hue': 'OrientationPreference', 'Confidence': None})])
This specifies that the final TemplatePlotGroup will contain up to one Plot named Activity per Sheet, although there could be no plots at all if no Sheet has a Image named Activity once ‘measure_activity()’ has been run. The Plot will be colored by OrientationPreference if such a Image exists for that Sheet, and the value (luminance) channel will be determined by the Image Activity. This plot will be listed in the category ‘Basic’ anywhere such categories are relevant (e.g. in the GUI).
Here’s a more complicated example specifying two different plots in the same PlotGroup:
TemplatePlotGroup(name='Orientation Preference', category='Basic'
    pre_plot_hooks=[measure_or_pref.instance()],
    plot_templates=
        [('Orientation Preference',
            {'Strength': None, 'Hue': 'OrientationPreference'}),
         ('Orientation Selectivity',
            {'Strength': 'OrientationSelectivity'})])
Here the TemplatePlotGroup will contain up to two Plots per Sheet, depending on which Sheets have OrientationPreference and OrientationSelectivity SheetViews.
The function create_plotgroup provides a convenient way to define plots using TemplatePlotGroups; search for create_plotgroup elsewhere in the code to see examples.
- param ObjectSelector normalize (allow_None=None, check_on_set=True, compute_default_fn=None, constant=False, default=None, instantiate=False, objects=[‘None’, ‘Individually’, ‘AllTogether’], pickle_default_value=True, precedence=None, readonly=False)
- ‘Individually’: scale each plot so that its maximum value is white and its minimum value black. ‘None’: no scaling (0.0 will be black and 1.0 will be white). ‘AllTogether’: scale each plot so that the highest maximum value is white, and the lowest minimum value is black. Normalizing ‘Individually’ has the advantage of ensuring that any data that is present will be visible, but the disadvantage that the absolute scale will be obscured. Non-normalized plots are guaranteed to be on a known scale, but only values between 0.0 and 1.0 will be visibly distinguishable.
- param Boolean enforce_minimum_plot_height (allow_None=False, bounds=(0, 1), constant=False, default=True, instantiate=False, pickle_default_value=True, precedence=None, readonly=False)
- If true, ensure that plots are never shown smaller than their native size, i.e. with fewer than one pixel per matrix unit. This option is normally left on for safety, so that no visualization will be missing any units. However, it may be acceptable to turn this check off when working with matrix sizes much larger than your screen resolution.
- param List prerequisites (allow_None=False, bounds=(0, None), constant=False, default=[], instantiate=True, pickle_default_value=True, precedence=None, readonly=False)
- List of preference maps that must exist before this plot can be calculated.
- param String doc (allow_None=False, basestring=<type ‘basestring’>, constant=False, default=, instantiate=False, pickle_default_value=True, precedence=None, readonly=False)
- Documentation string describing this type of plot.
- param Boolean sheet_coords (allow_None=False, bounds=(0, 1), constant=False, default=False, instantiate=False, pickle_default_value=True, precedence=None, readonly=False)
- Whether to scale plots based on their relative sizes in sheet coordinates. If true, plots are scaled so that their sizes are proportional to their area in sheet coordinates, so that one can compare corresponding areas. If false, plots are scaled to have similar sizes on screen, regardless of their corresponding sheet areas, which maximizes the size of each plot.
- param ObjectSelector color_channel (allow_None=None, check_on_set=True, compute_default_fn=None, constant=False, default=None, instantiate=False, objects=[‘None’], pickle_default_value=True, precedence=None, readonly=False)
- Defines the color channel to be displayed in the GUI, can usually be set to a measured OrientationMap
- param Boolean auto_refresh (allow_None=False, bounds=(0, 1), constant=False, default=False, instantiate=False, pickle_default_value=True, precedence=None, readonly=False)
- If this plot is being displayed persistently (e.g. in a GUI), whether to regenerate it automatically whenever the simulation time advances. The default is False, because many plots are slow to generate (including most preference map plots).
- param Number desired_maximum_plot_height (allow_None=False, bounds=(0, None), constant=False, default=0, inclusive_bounds=(True, True), instantiate=False, pickle_default_value=True, precedence=None, readonly=False, time_dependent=True, time_fn=<Time Time00001>)
- User-specified height of the tallest plot in this PlotGroup. Other plots will generally be scaled as appropriate, either to match this size (when sheet_coords is False), or to have the appropriate relative size (when sheet_coords is True). If enforce_minimum_plot_height is True, the actual maximum plot height may be larger than this parameter’s value. In particular, with enforce_minimum_plot_height=True, the default value of 0 gives plots that are the size of the underlying matrix, which is the most efficient size for saving plots directly to disk. Larger values (e.g. 150) are suitable when displaying plots on screen.
- param HookList pre_plot_hooks (allow_None=False, bounds=(0, None), constant=False, default=[], instantiate=True, pickle_default_value=True, precedence=None, readonly=False)
- Commands to execute before updating this plot, e.g. to calculate sheet views. The commands can be any callable Python objects, i.e. any x for which x() is valid. The initial value is determined by the template for this plot, but various arguments can be passed, a modified version substituted, etc.
- param Boolean plot_immediately (allow_None=False, bounds=(0, 1), constant=False, default=False, instantiate=False, pickle_default_value=True, precedence=None, readonly=False)
- Whether to call the pre-plot hooks at once or only when the user asks for a refresh. Should be set to true for quick plots, but false for those that take a long time to calculate, so that the user can change the hooks if necessary.
- param HookList plot_hooks (allow_None=False, bounds=(0, None), constant=False, default=[], instantiate=True, pickle_default_value=True, precedence=None, readonly=False)
- Commands to execute when redrawing a plot rather than regenerating data. E.g, for a plot with data measured once but displayed one sheet or unit at at time, this command will be called whenever the sheet or coordinate of unit to be plotted (or the simulator time) has changed. The commands can be any callable Python objects, i.e. any x for which x() is valid. The initial value is determined by the template for this plot, but various arguments can be passed, a modified version substituted, etc.
- param Boolean integer_scaling (allow_None=False, bounds=(0, 1), constant=False, default=False, instantiate=False, pickle_default_value=True, precedence=None, readonly=False)
- When scaling bitmaps, whether to ensure that the scaled bitmap is an even multiple of the original. If true, every unit will be represented by a square of the same size. Typically false so that the overall area will be correct, e.g. when using Sheet coordinates, which is often more important.
- param String category (allow_None=False, basestring=<type ‘basestring’>, constant=False, default=User, instantiate=False, pickle_default_value=True, precedence=None, readonly=False)
- Category to which this plot belongs, which will be created if necessary.
- param Callable filterfn (allow_None=False, constant=False, instantiate=False, pickle_default_value=True, precedence=None, readonly=False)
- Boolean function allowing control over which items will be plotted. E.g.: filterfn=lambda x: x.name in [‘Retina’,’V1’] for a plot ranging over Sheets, or filterfn=lambda x: x[0]==x[1] for a plot ranging over coordinates.
- add_static_image(name, file_path)[source]
Construct a static image Plot (e.g. a color key for an Orientation Preference map).
- coords
Calculate the grid layout of the plots from their precedences and row_precedences. Returns a list of triples (row, col, plot).
- debug(msg, *args, **kw)
Print msg merged with args as a debugging statement.
See Python’s logging module for details of message formatting.
- defaults()
Return {parameter_name:parameter.default} for all non-constant Parameters.
Note that a Parameter for which instantiate==True has its default instantiated.
- force_new_dynamic_value = <functools.partial object at 0x2b07af1b0e10>
- get_param_values(onlychanged=False)
Return a list of name,value pairs for all Parameters of this object.
If onlychanged is True, will only return values that are not equal to the default value.
- get_value_generator = <functools.partial object at 0x2b07af1b0e68>
- grid
Return the plots in grid format, i.e., a list of rows, each of which is a list of plots. The rows are right padded with None as necessary.
- inspect_value = <functools.partial object at 0x2b07af1b0d08>
- make_plots(update=True)
Create and scale the plots, after first executing the PlotGroup’s pre_plot_hooks (if update is True) and plot_hooks.
- message(msg, *args, **kw)
Print msg merged with args as a message.
See Python’s logging module for details of message formatting.
- classmethod params(parameter_name=None)
Return the Parameters of this class as the dictionary {name: parameter_object}
Includes Parameters from this class and its superclasses.
- pprint(imports=None, prefix=' ', unknown_value='<?>', qualify=False, separator='')
(Experimental) Pretty printed representation that may be evaluated with eval. See pprint() function for more details.
- classmethod print_param_defaults()
Print the default values of all cls’s Parameters.
- print_param_values()
Print the values of all this object’s Parameters.
- scale_images(zoom_factor=None)
Enlarge or reduce the bitmaps as needed for display.
The calculated sizes will be multiplied by the given zoom_factor, if it is not None.
If the scaled sizes would be outside of the allowed range, no scaling is done, and False is returned. (One might conceivably instead want the scaling to reach the actual minimum or maximum allowed, but if we did this, then repeated enlargements and reductions would not be reversible, unless we were very tricky about how we did it.)
- script_repr(imports=, []prefix=' ')
Variant of __repr__ designed for generating a runnable script.
- classmethod set_default(param_name, value)
Set the default value of param_name.
Equivalent to setting param_name on the class.
- set_dynamic_time_fn = <functools.partial object at 0x2b07af1b0db8>
- set_param = <functools.partial object at 0x2b07af1b0b50>
- state_pop()
Restore the most recently saved state.
See state_push() for more details.
- state_push()
Save this instance’s state.
For Parameterized instances, this includes the state of dynamically generated values.
Subclasses that maintain short-term state should additionally save and restore that state using state_push() and state_pop().
Generally, this method is used by operations that need to test something without permanently altering the objects’ state.
- update_maximum_plot_height(zoom_factor=None)
Determine which plot will be the largest, based on the settings for minimum plot heights, the specified zoom factor (if not None), etc.
A minimum size (and potentially a maximum size) are enforced, as described below.
If the scaled sizes would be outside of the allowed range, False is returned.
For matrix coordinate plots (sheet_coords=False), the minimum size is calculated as the native size of the largest bitmap to be plotted. Other plots are then usually scaled up to (but not greater than) this size, so that all plots are approximately the same size, and no plot is missing any pixel.
For Sheet coordinate plots, the minimum plotting density that will avoid losing pixels is determined by the maximum density from any sheet. If all plots are then drawn at that density (as they must be for them to be in Sheet coordinates), the largest plot will then be the one with the largest sheet bounds, and the size of that plot will be the maximum density times the largest sheet bounds.
- verbose(msg, *args, **kw)
Print msg merged with args as a verbose message.
See Python’s logging module for details of message formatting.
- warning(msg, *args, **kw)
Print msg merged with args as a warning, unless module variable warnings_as_exceptions is True, then raise an Exception containing the arguments.
See Python’s logging module for details of message formatting.
- class topo.plotting.plotgroup.TwoOrientationsPlotGroup(plot_templates=None, static_images=None, **params)[source]
Bases: topo.plotting.plotgroup.TemplatePlotGroup
Display with small segments the two most preferred orientations for each units in the sheet. Only orientation with significative selectivity are shown. Darker segments correspond to orientations with more selective response.
- param ObjectSelector normalize (allow_None=None, check_on_set=True, compute_default_fn=None, constant=False, default=None, instantiate=False, objects=[‘None’, ‘Individually’, ‘AllTogether’], pickle_default_value=True, precedence=None, readonly=False)
- ‘Individually’: scale each plot so that its maximum value is white and its minimum value black. ‘None’: no scaling (0.0 will be black and 1.0 will be white). ‘AllTogether’: scale each plot so that the highest maximum value is white, and the lowest minimum value is black. Normalizing ‘Individually’ has the advantage of ensuring that any data that is present will be visible, but the disadvantage that the absolute scale will be obscured. Non-normalized plots are guaranteed to be on a known scale, but only values between 0.0 and 1.0 will be visibly distinguishable.
- param Boolean enforce_minimum_plot_height (allow_None=False, bounds=(0, 1), constant=False, default=True, instantiate=False, pickle_default_value=True, precedence=None, readonly=False)
- If true, ensure that plots are never shown smaller than their native size, i.e. with fewer than one pixel per matrix unit. This option is normally left on for safety, so that no visualization will be missing any units. However, it may be acceptable to turn this check off when working with matrix sizes much larger than your screen resolution.
- param List prerequisites (allow_None=False, bounds=(0, None), constant=False, default=[], instantiate=True, pickle_default_value=True, precedence=None, readonly=False)
- List of preference maps that must exist before this plot can be calculated.
- param String doc (allow_None=False, basestring=<type ‘basestring’>, constant=False, default=, instantiate=False, pickle_default_value=True, precedence=None, readonly=False)
- Documentation string describing this type of plot.
- param Boolean sheet_coords (allow_None=False, bounds=(0, 1), constant=False, default=False, instantiate=False, pickle_default_value=True, precedence=None, readonly=False)
- Whether to scale plots based on their relative sizes in sheet coordinates. If true, plots are scaled so that their sizes are proportional to their area in sheet coordinates, so that one can compare corresponding areas. If false, plots are scaled to have similar sizes on screen, regardless of their corresponding sheet areas, which maximizes the size of each plot.
- param ObjectSelector color_channel (allow_None=None, check_on_set=True, compute_default_fn=None, constant=False, default=None, instantiate=False, objects=[‘None’], pickle_default_value=True, precedence=None, readonly=False)
- Defines the color channel to be displayed in the GUI, can usually be set to a measured OrientationMap
- param Boolean auto_refresh (allow_None=False, bounds=(0, 1), constant=False, default=False, instantiate=False, pickle_default_value=True, precedence=None, readonly=False)
- If this plot is being displayed persistently (e.g. in a GUI), whether to regenerate it automatically whenever the simulation time advances. The default is False, because many plots are slow to generate (including most preference map plots).
- param Number unit_size (allow_None=False, bounds=(9, None), constant=False, default=25, inclusive_bounds=(True, True), instantiate=False, pickle_default_value=True, precedence=None, readonly=False, time_dependent=True, time_fn=<Time Time00001>)
- box size of a single unit
- param Number desired_maximum_plot_height (allow_None=False, bounds=(0, None), constant=False, default=0, inclusive_bounds=(True, True), instantiate=False, pickle_default_value=True, precedence=None, readonly=False, time_dependent=True, time_fn=<Time Time00001>)
- User-specified height of the tallest plot in this PlotGroup. Other plots will generally be scaled as appropriate, either to match this size (when sheet_coords is False), or to have the appropriate relative size (when sheet_coords is True). If enforce_minimum_plot_height is True, the actual maximum plot height may be larger than this parameter’s value. In particular, with enforce_minimum_plot_height=True, the default value of 0 gives plots that are the size of the underlying matrix, which is the most efficient size for saving plots directly to disk. Larger values (e.g. 150) are suitable when displaying plots on screen.
- param HookList pre_plot_hooks (allow_None=False, bounds=(0, None), constant=False, default=[], instantiate=True, pickle_default_value=True, precedence=None, readonly=False)
- Commands to execute before updating this plot, e.g. to calculate sheet views. The commands can be any callable Python objects, i.e. any x for which x() is valid. The initial value is determined by the template for this plot, but various arguments can be passed, a modified version substituted, etc.
- param Boolean plot_immediately (allow_None=False, bounds=(0, 1), constant=False, default=False, instantiate=False, pickle_default_value=True, precedence=None, readonly=False)
- Whether to call the pre-plot hooks at once or only when the user asks for a refresh. Should be set to true for quick plots, but false for those that take a long time to calculate, so that the user can change the hooks if necessary.
- param HookList plot_hooks (allow_None=False, bounds=(0, None), constant=False, default=[], instantiate=True, pickle_default_value=True, precedence=None, readonly=False)
- Commands to execute when redrawing a plot rather than regenerating data. E.g, for a plot with data measured once but displayed one sheet or unit at at time, this command will be called whenever the sheet or coordinate of unit to be plotted (or the simulator time) has changed. The commands can be any callable Python objects, i.e. any x for which x() is valid. The initial value is determined by the template for this plot, but various arguments can be passed, a modified version substituted, etc.
- param Boolean integer_scaling (allow_None=False, bounds=(0, 1), constant=False, default=False, instantiate=False, pickle_default_value=True, precedence=None, readonly=False)
- When scaling bitmaps, whether to ensure that the scaled bitmap is an even multiple of the original. If true, every unit will be represented by a square of the same size. Typically false so that the overall area will be correct, e.g. when using Sheet coordinates, which is often more important.
- param String category (allow_None=False, basestring=<type ‘basestring’>, constant=False, default=User, instantiate=False, pickle_default_value=True, precedence=None, readonly=False)
- Category to which this plot belongs, which will be created if necessary.
- param Callable filterfn (allow_None=False, constant=False, instantiate=False, pickle_default_value=True, precedence=None, readonly=False)
- Boolean function allowing control over which items will be plotted. E.g.: filterfn=lambda x: x.name in [‘Retina’,’V1’] for a plot ranging over Sheets, or filterfn=lambda x: x[0]==x[1] for a plot ranging over coordinates.
- add_static_image(name, file_path)
Construct a static image Plot (e.g. a color key for an Orientation Preference map).
- coords
Calculate the grid layout of the plots from their precedences and row_precedences. Returns a list of triples (row, col, plot).
- debug(msg, *args, **kw)
Print msg merged with args as a debugging statement.
See Python’s logging module for details of message formatting.
- defaults()
Return {parameter_name:parameter.default} for all non-constant Parameters.
Note that a Parameter for which instantiate==True has its default instantiated.
- force_new_dynamic_value = <functools.partial object at 0x2b07af1b0c00>
- get_param_values(onlychanged=False)
Return a list of name,value pairs for all Parameters of this object.
If onlychanged is True, will only return values that are not equal to the default value.
- get_value_generator = <functools.partial object at 0x2b07af1b0c58>
- grid
Return the plots in grid format, i.e., a list of rows, each of which is a list of plots. The rows are right padded with None as necessary.
- inspect_value = <functools.partial object at 0x2b07af1b0f18>
- make_plots(update=True)
Create and scale the plots, after first executing the PlotGroup’s pre_plot_hooks (if update is True) and plot_hooks.
- message(msg, *args, **kw)
Print msg merged with args as a message.
See Python’s logging module for details of message formatting.
- classmethod params(parameter_name=None)
Return the Parameters of this class as the dictionary {name: parameter_object}
Includes Parameters from this class and its superclasses.
- pprint(imports=None, prefix=' ', unknown_value='<?>', qualify=False, separator='')
(Experimental) Pretty printed representation that may be evaluated with eval. See pprint() function for more details.
- classmethod print_param_defaults()
Print the default values of all cls’s Parameters.
- print_param_values()
Print the values of all this object’s Parameters.
- scale_images(zoom_factor=None)
Enlarge or reduce the bitmaps as needed for display.
The calculated sizes will be multiplied by the given zoom_factor, if it is not None.
If the scaled sizes would be outside of the allowed range, no scaling is done, and False is returned. (One might conceivably instead want the scaling to reach the actual minimum or maximum allowed, but if we did this, then repeated enlargements and reductions would not be reversible, unless we were very tricky about how we did it.)
- script_repr(imports=, []prefix=' ')
Variant of __repr__ designed for generating a runnable script.
- classmethod set_default(param_name, value)
Set the default value of param_name.
Equivalent to setting param_name on the class.
- set_dynamic_time_fn = <functools.partial object at 0x2b07af1b0fc8>
- set_param = <functools.partial object at 0x2b07af1b0f70>
- state_pop()
Restore the most recently saved state.
See state_push() for more details.
- state_push()
Save this instance’s state.
For Parameterized instances, this includes the state of dynamically generated values.
Subclasses that maintain short-term state should additionally save and restore that state using state_push() and state_pop().
Generally, this method is used by operations that need to test something without permanently altering the objects’ state.
- update_maximum_plot_height(zoom_factor=None)
Determine which plot will be the largest, based on the settings for minimum plot heights, the specified zoom factor (if not None), etc.
A minimum size (and potentially a maximum size) are enforced, as described below.
If the scaled sizes would be outside of the allowed range, False is returned.
For matrix coordinate plots (sheet_coords=False), the minimum size is calculated as the native size of the largest bitmap to be plotted. Other plots are then usually scaled up to (but not greater than) this size, so that all plots are approximately the same size, and no plot is missing any pixel.
For Sheet coordinate plots, the minimum plotting density that will avoid losing pixels is determined by the maximum density from any sheet. If all plots are then drawn at that density (as they must be for them to be in Sheet coordinates), the largest plot will then be the one with the largest sheet bounds, and the size of that plot will be the maximum density times the largest sheet bounds.
- verbose(msg, *args, **kw)
Print msg merged with args as a verbose message.
See Python’s logging module for details of message formatting.
- warning(msg, *args, **kw)
Print msg merged with args as a warning, unless module variable warnings_as_exceptions is True, then raise an Exception containing the arguments.
See Python’s logging module for details of message formatting.
- class topo.plotting.plotgroup.UnitPlotGroup(plot_templates=None, static_images=None, **params)[source]
Bases: topo.plotting.plotgroup.ProjectionSheetPlotGroup
Visualize anything related to a unit.
- param ObjectSelector normalize (allow_None=None, check_on_set=True, compute_default_fn=None, constant=False, default=None, instantiate=False, objects=[‘None’, ‘Individually’, ‘AllTogether’, ‘JointProjections’], pickle_default_value=True, precedence=None, readonly=False)
- ‘Individually’: scale each plot so that the peak value will be white and the minimum value black. ‘None’: no scaling - 0.0 will be black and 1.0 will be white. ‘AllTogether’: scale each plot so that the peak value of all the plots is white, and the minimum value of all the plots will be black. ‘JointProjections’: as ‘Individually’, except that plots produced from projections whose weights are jointly normalized will be jointly normalized. Normalization has the advantage of ensuring that any data that is present will be visible, but the disadvantage that the absolute scale will be obscured. Non-normalized plots are guaranteed to be on a known scale, but only values between 0.0 and 1.0 will be visibly distinguishable.
- param Boolean enforce_minimum_plot_height (allow_None=False, bounds=(0, 1), constant=False, default=True, instantiate=False, pickle_default_value=True, precedence=None, readonly=False)
- If true, ensure that plots are never shown smaller than their native size, i.e. with fewer than one pixel per matrix unit. This option is normally left on for safety, so that no visualization will be missing any units. However, it may be acceptable to turn this check off when working with matrix sizes much larger than your screen resolution.
- param ObjectSelector sheet (allow_None=None, check_on_set=False, constant=False, default=None, instantiate=False, objects=[], pickle_default_value=True, precedence=None, readonly=False)
- The Sheet from which to produce plots.
- param List prerequisites (allow_None=False, bounds=(0, None), constant=False, default=[], instantiate=True, pickle_default_value=True, precedence=None, readonly=False)
- List of preference maps that must exist before this plot can be calculated.
- param String doc (allow_None=False, basestring=<type ‘basestring’>, constant=False, default=, instantiate=False, pickle_default_value=True, precedence=None, readonly=False)
- Documentation string describing this type of plot.
- param Boolean sheet_coords (allow_None=False, bounds=(0, 1), constant=False, default=False, instantiate=False, pickle_default_value=True, precedence=None, readonly=False)
- Whether to scale plots based on their relative sizes in sheet coordinates. If true, plots are scaled so that their sizes are proportional to their area in sheet coordinates, so that one can compare corresponding areas. If false, plots are scaled to have similar sizes on screen, regardless of their corresponding sheet areas, which maximizes the size of each plot.
- param ObjectSelector color_channel (allow_None=None, check_on_set=True, compute_default_fn=None, constant=False, default=None, instantiate=False, objects=[‘None’], pickle_default_value=True, precedence=None, readonly=False)
- Defines the color channel to be displayed in the GUI, can usually be set to a measured OrientationMap
- param Boolean auto_refresh (allow_None=False, bounds=(0, 1), constant=False, default=False, instantiate=False, pickle_default_value=True, precedence=None, readonly=False)
- If this plot is being displayed persistently (e.g. in a GUI), whether to regenerate it automatically whenever the simulation time advances. The default is False, because many plots are slow to generate (including most preference map plots).
- param Number desired_maximum_plot_height (allow_None=False, bounds=(0, None), constant=False, default=0, inclusive_bounds=(True, True), instantiate=False, pickle_default_value=True, precedence=None, readonly=False, time_dependent=True, time_fn=<Time Time00001>)
- User-specified height of the tallest plot in this PlotGroup. Other plots will generally be scaled as appropriate, either to match this size (when sheet_coords is False), or to have the appropriate relative size (when sheet_coords is True). If enforce_minimum_plot_height is True, the actual maximum plot height may be larger than this parameter’s value. In particular, with enforce_minimum_plot_height=True, the default value of 0 gives plots that are the size of the underlying matrix, which is the most efficient size for saving plots directly to disk. Larger values (e.g. 150) are suitable when displaying plots on screen.
- param HookList pre_plot_hooks (allow_None=False, bounds=(0, None), constant=False, default=[], instantiate=True, pickle_default_value=True, precedence=None, readonly=False)
- Commands to execute before updating this plot, e.g. to calculate sheet views. The commands can be any callable Python objects, i.e. any x for which x() is valid. The initial value is determined by the template for this plot, but various arguments can be passed, a modified version substituted, etc.
- param Boolean plot_immediately (allow_None=False, bounds=(0, 1), constant=False, default=False, instantiate=False, pickle_default_value=True, precedence=None, readonly=False)
- Whether to call the pre-plot hooks at once or only when the user asks for a refresh. Should be set to true for quick plots, but false for those that take a long time to calculate, so that the user can change the hooks if necessary.
- param HookList plot_hooks (allow_None=False, bounds=(0, None), constant=False, default=[], instantiate=True, pickle_default_value=True, precedence=None, readonly=False)
- Commands to execute when redrawing a plot rather than regenerating data. E.g, for a plot with data measured once but displayed one sheet or unit at at time, this command will be called whenever the sheet or coordinate of unit to be plotted (or the simulator time) has changed. The commands can be any callable Python objects, i.e. any x for which x() is valid. The initial value is determined by the template for this plot, but various arguments can be passed, a modified version substituted, etc.
- param Boolean integer_scaling (allow_None=False, bounds=(0, 1), constant=False, default=False, instantiate=False, pickle_default_value=True, precedence=None, readonly=False)
- When scaling bitmaps, whether to ensure that the scaled bitmap is an even multiple of the original. If true, every unit will be represented by a square of the same size. Typically false so that the overall area will be correct, e.g. when using Sheet coordinates, which is often more important.
- param Number y (allow_None=False, bounds=None, constant=False, default=0.0, inclusive_bounds=(True, True), instantiate=False, pickle_default_value=True, precedence=None, readonly=False, time_dependent=True, time_fn=<Time Time00001>)
- y-coordinate of the unit to plot
- param Number x (allow_None=False, bounds=None, constant=False, default=0.0, inclusive_bounds=(True, True), instantiate=False, pickle_default_value=True, precedence=None, readonly=False, time_dependent=True, time_fn=<Time Time00001>)
- x-coordinate of the unit to plot
- param String category (allow_None=False, basestring=<type ‘basestring’>, constant=False, default=User, instantiate=False, pickle_default_value=True, precedence=None, readonly=False)
- Category to which this plot belongs, which will be created if necessary.
- param Callable filterfn (allow_None=False, constant=False, instantiate=False, pickle_default_value=True, precedence=None, readonly=False)
- Boolean function allowing control over which items will be plotted. E.g.: filterfn=lambda x: x.name in [‘Retina’,’V1’] for a plot ranging over Sheets, or filterfn=lambda x: x[0]==x[1] for a plot ranging over coordinates.
- add_static_image(name, file_path)
Construct a static image Plot (e.g. a color key for an Orientation Preference map).
- coords
Calculate the grid layout of the plots from their precedences and row_precedences. Returns a list of triples (row, col, plot).
- debug(msg, *args, **kw)
Print msg merged with args as a debugging statement.
See Python’s logging module for details of message formatting.
- defaults()
Return {parameter_name:parameter.default} for all non-constant Parameters.
Note that a Parameter for which instantiate==True has its default instantiated.
- force_new_dynamic_value = <functools.partial object at 0x2b07af1b0aa0>
- get_param_values(onlychanged=False)
Return a list of name,value pairs for all Parameters of this object.
If onlychanged is True, will only return values that are not equal to the default value.
- get_value_generator = <functools.partial object at 0x2b07af1b0e10>
- grid
Return the plots in grid format, i.e., a list of rows, each of which is a list of plots. The rows are right padded with None as necessary.
- inspect_value = <functools.partial object at 0x2b07af1b0e68>
- make_plots(update=True)
Create and scale the plots, after first executing the PlotGroup’s pre_plot_hooks (if update is True) and plot_hooks.
- message(msg, *args, **kw)
Print msg merged with args as a message.
See Python’s logging module for details of message formatting.
- classmethod params(parameter_name=None)
Return the Parameters of this class as the dictionary {name: parameter_object}
Includes Parameters from this class and its superclasses.
- pprint(imports=None, prefix=' ', unknown_value='<?>', qualify=False, separator='')
(Experimental) Pretty printed representation that may be evaluated with eval. See pprint() function for more details.
- classmethod print_param_defaults()
Print the default values of all cls’s Parameters.
- print_param_values()
Print the values of all this object’s Parameters.
- scale_images(zoom_factor=None)
Enlarge or reduce the bitmaps as needed for display.
The calculated sizes will be multiplied by the given zoom_factor, if it is not None.
If the scaled sizes would be outside of the allowed range, no scaling is done, and False is returned. (One might conceivably instead want the scaling to reach the actual minimum or maximum allowed, but if we did this, then repeated enlargements and reductions would not be reversible, unless we were very tricky about how we did it.)
- script_repr(imports=, []prefix=' ')
Variant of __repr__ designed for generating a runnable script.
- classmethod set_default(param_name, value)
Set the default value of param_name.
Equivalent to setting param_name on the class.
- set_dynamic_time_fn = <functools.partial object at 0x2b07af1b0d08>
- set_param = <functools.partial object at 0x2b07af1b0ba8>
- sheet_type
alias of ProjectionSheet
- state_pop()
Restore the most recently saved state.
See state_push() for more details.
- state_push()
Save this instance’s state.
For Parameterized instances, this includes the state of dynamically generated values.
Subclasses that maintain short-term state should additionally save and restore that state using state_push() and state_pop().
Generally, this method is used by operations that need to test something without permanently altering the objects’ state.
- update_maximum_plot_height(zoom_factor=None)
Determine which plot will be the largest, based on the settings for minimum plot heights, the specified zoom factor (if not None), etc.
A minimum size (and potentially a maximum size) are enforced, as described below.
If the scaled sizes would be outside of the allowed range, False is returned.
For matrix coordinate plots (sheet_coords=False), the minimum size is calculated as the native size of the largest bitmap to be plotted. Other plots are then usually scaled up to (but not greater than) this size, so that all plots are approximately the same size, and no plot is missing any pixel.
For Sheet coordinate plots, the minimum plotting density that will avoid losing pixels is determined by the maximum density from any sheet. If all plots are then drawn at that density (as they must be for them to be in Sheet coordinates), the largest plot will then be the one with the largest sheet bounds, and the size of that plot will be the maximum density times the largest sheet bounds.
- verbose(msg, *args, **kw)
Print msg merged with args as a verbose message.
See Python’s logging module for details of message formatting.
- warning(msg, *args, **kw)
Print msg merged with args as a warning, unless module variable warnings_as_exceptions is True, then raise an Exception containing the arguments.
See Python’s logging module for details of message formatting.
- topo.plotting.plotgroup.create_plotgroup(template_plot_type='bitmap', **params)[source]
Create a new PlotGroup and add it to the plotgroups list.
Convenience function to make it simpler to use the name of the PlotGroup as the key in the plotgroups list.
template_plot_type: Whether the plots are bitmap images or curves (‘curve’).
- topo.plotting.plotgroup.default_input_sheet()[source]
Returns the first GeneratorSheet defined, for use as a default value.
- topo.plotting.plotgroup.default_measureable_sheet()[source]
Returns the first sheet for which measure_maps is True (if any), or else the first sheet, for use as a default value.
- topo.plotting.plotgroup.plotgroups = OrderedDict([('Activity', TemplatePlotGroup(auto_refresh=True, category='Basic', color_channel='None', desired_maximum_plot_height=0, doc='Plot the activity for all Sheets.', enforce_minimum_plot_height=True, filterfn=<function alwaystrue at 0x2b07ab86fb90>, integer_scaling=False, name='Activity', normalize='None', plot_hooks=[], plot_immediately=True, pre_plot_hooks=[<function update_activity at 0x2b07a8f5de60>], prerequisites=[], sheet_coords=False)), ('Connection Fields', ConnectionFieldsPlotGroup(auto_refresh=False, category='Basic', color_channel='None', desired_maximum_plot_height=0, doc='Plot the weight strength in each ConnectionField of a specific unit of a Sheet.', enforce_minimum_plot_height=True, filterfn=<function alwaystrue at 0x2b07ab86fb90>, integer_scaling=False, name='Connection Fields', normalize='Individually', plot_hooks=[], plot_immediately=True, pre_plot_hooks=[<class 'topo.analysis.command.update_connectionfields'>], prerequisites=[], sheet=None, sheet_coords=False, situate=True, x=0.0, y=0.0)), ('Projection', CFProjectionPlotGroup(auto_refresh=False, category='Basic', color_channel='None', density=10.0, desired_maximum_plot_height=0, doc='Plot the weights of an array of ConnectionFields in a Projection.', enforce_minimum_plot_height=True, filterfn=<function alwaystrue at 0x2b07ab86fb90>, integer_scaling=False, name='Projection', normalize='Individually', plot_hooks=[], plot_immediately=False, pre_plot_hooks=[<class 'topo.analysis.command.update_projection'>], prerequisites=[], projection=None, sheet=None, sheet_coords=True, situate=False)), ('RGB', TemplatePlotGroup(auto_refresh=True, category='Other', color_channel='None', desired_maximum_plot_height=0, doc='Combine and plot the red, green, and blue activity for all appropriate Sheets.', enforce_minimum_plot_height=True, filterfn=<function alwaystrue at 0x2b07ab86fb90>, integer_scaling=False, name='RGB', normalize='None', plot_hooks=[], plot_immediately=True, pre_plot_hooks=[<function update_rgb_activities at 0x2b07a9d3c5f0>], prerequisites=[], sheet_coords=False)), ('Projection Activity', ProjectionActivityPlotGroup(auto_refresh=True, category='Basic', color_channel='None', desired_maximum_plot_height=0, doc='Plot the activity in each Projection that connects to a Sheet.', enforce_minimum_plot_height=True, filterfn=<function alwaystrue at 0x2b07ab86fb90>, integer_scaling=False, name='Projection Activity', normalize='Individually', plot_hooks=[], plot_immediately=True, pre_plot_hooks=[update_projectionactivity(name='update_projectionactivity01351', outputs=[])], prerequisites=[], sheet=None, sheet_coords=False)), ('Center of Gravity', TemplatePlotGroup(auto_refresh=False, category='Preference Maps', color_channel='None', desired_maximum_plot_height=0, doc='Measure the center of gravity of each ConnectionField in a Projection.', enforce_minimum_plot_height=True, filterfn=<function alwaystrue at 0x2b07ab86fb90>, integer_scaling=False, name='Center of Gravity', normalize='Individually', plot_hooks=[topographic_grid(axis=[-0.5, 0.5, -0.5, 0.5], display_window=True, file_dpi=100.0, file_format='png', filename=None, filename_suffix='', name='topographic_grid01356', skip=1, title=None, x=None, xsheet_view_name='XCoG', y=None, ysheet_view_name='YCoG')], plot_immediately=False, pre_plot_hooks=[measure_cog(measurement_storage_hook=StorageHook(name='StorageHook01355', only_latest=True, sublabel='CoG'), name='measure_cog01354', proj_name='', stride=1)], prerequisites=[], sheet_coords=False)), ('RF Projection', RFProjectionPlotGroup(auto_refresh=False, category='Other', color_channel='None', density=10.0, desired_maximum_plot_height=0, doc='Measure white noise receptive fields.', enforce_minimum_plot_height=True, filterfn=<function alwaystrue at 0x2b07ab86fb90>, input_sheet=None, integer_scaling=False, name='RF Projection', normalize='Individually', plot_hooks=[], plot_immediately=False, pre_plot_hooks=[measure_rfs(durations=[1.0], inputs=[], measurement_prefix='', metafeature_fns=[<class 'featuremapper.metaparams.contrast2scale'>], name='measure_rfs01360', offset=0.5, outputs=[], pattern_generator=UniformRandom(bounds=BoundingBox(radius=0.5), group='Pattern', mask=None, mask_shape=None, name='UniformNoise', offset=0.0, orientation=0.0, output_fns=[], position=[0.0, 0.0], random_generator=<mtrand.RandomState object at 0x2b07962d7dd0>, scale=1.0, size=1.0, time_dependent=False, time_fn=Time(label='Time', name='Time00001', time_type=<built-in function mpq>, timestep=1.0, unit=None, until=Infinity()), x=0.0, xdensity=256, y=0.0, ydensity=256, z=None), pattern_response_fn=pattern_response(apply_output_fns=True, durations=[1.0], inputs={}, install_sheetview=False, measurement_prefix='', name='pattern_response01311', overwrite_previous=False, plastic=False, progress_bar=True, restore_events=True, restore_state=True, return_responses=True), preference_fn=DSF_MaxValue(name='DSF_MaxValue01361', selectivity_scale=(0.0, 1.0), value_scale=(0.0, 1.0)), preference_lookup_fn=<function get_feature_preference at 0x2b07a8f600c8>, presentations=100, roi=(0, 0, 0, 0), scale=30.0, static_parameters=['scale', 'offset'], subplot='')], prerequisites=[], sheet=None, sheet_coords=False)), ('Orientation Preference', TemplatePlotGroup(auto_refresh=False, category='Preference Maps', color_channel='None', desired_maximum_plot_height=0, doc='Measure preference for sine grating orientation.', enforce_minimum_plot_height=True, filterfn=<function alwaystrue at 0x2b07ab86fb90>, integer_scaling=False, name='Orientation Preference', normalize='None', plot_hooks=[], plot_immediately=False, pre_plot_hooks=[measure_sine_pref(durations=[1.0], frequencies=[2.4], inputs=[], max_speed=0.08333333333333333, measurement_prefix='', metafeature_fns=[<class 'featuremapper.metaparams.contrast2scale'>, <class 'featuremapper.metaparams.direction2translation'>], name='measure_sine_pref01365', num_direction=0, num_disparity=1, num_hue=1, num_ocularity=1, num_orientation=4, num_phase=18, num_speeds=4, offset=0.0, outputs=[], pattern_generator=SineGrating(bounds=BoundingBox(radius=0.5), frequency=2.4, group='Pattern', mask=None, mask_shape=None, name='SineGrating01367', offset=0.0, orientation=0.0, output_fns=[], phase=0.0, position=[0.0, 0.0], scale=1.0, size=1.0, x=0.0, xdensity=256, y=0.0, ydensity=256, z=None), pattern_response_fn=pattern_response(apply_output_fns=True, durations=[1.0], inputs={}, install_sheetview=False, measurement_prefix='', name='pattern_response01311', overwrite_previous=False, plastic=False, progress_bar=True, restore_events=True, restore_state=True, return_responses=True), preference_fn=DSF_WeightedAverage(name='DSF_WeightedAverage01366', selectivity_scale=(0.0, 1.0), value_scale=(0.0, 1.0)), preference_lookup_fn=<function get_feature_preference at 0x2b07a8f600c8>, scale=0.3, static_parameters=['scale', 'offset'], subplot='Orientation')], prerequisites=[], sheet_coords=False)), ('vonMises Orientation Preference', TemplatePlotGroup(auto_refresh=False, category='Preference Maps', color_channel='None', desired_maximum_plot_height=0, doc='Measure preference for sine grating orientation using von Mises fit.', enforce_minimum_plot_height=True, filterfn=<function alwaystrue at 0x2b07ab86fb90>, integer_scaling=False, name='vonMises Orientation Preference', normalize='None', plot_hooks=[], plot_immediately=False, pre_plot_hooks=[measure_sine_pref(durations=[1.0], frequencies=[2.4], inputs=[], max_speed=0.08333333333333333, measurement_prefix='', metafeature_fns=[<class 'featuremapper.metaparams.contrast2scale'>, <class 'featuremapper.metaparams.direction2translation'>], name='measure_sine_pref01373', num_direction=0, num_disparity=1, num_hue=1, num_ocularity=1, num_orientation=16, num_phase=18, num_speeds=4, offset=0.0, outputs=[], pattern_generator=SineGrating(bounds=BoundingBox(radius=0.5), frequency=2.4, group='Pattern', mask=None, mask_shape=None, name='SineGrating01375', offset=0.0, orientation=0.0, output_fns=[], phase=0.0, position=[0.0, 0.0], scale=1.0, size=1.0, x=0.0, xdensity=256, y=0.0, ydensity=256, z=None), pattern_response_fn=pattern_response(apply_output_fns=True, durations=[1.0], inputs={}, install_sheetview=False, measurement_prefix='', name='pattern_response01311', overwrite_previous=False, plastic=False, progress_bar=True, restore_events=True, restore_state=True, return_responses=True), preference_fn=DSF_VonMisesFit(name='DSF_VonMisesFit01372', selectivity_scale=(0.0, 1.0), value_scale=(0.0, 1.0), worst_fit=0.5), preference_lookup_fn=<function get_feature_preference at 0x2b07a8f600c8>, scale=0.3, static_parameters=['scale', 'offset'], subplot='Orientation')], prerequisites=[], sheet_coords=False)), ('Bimodal Orientation Preference', TemplatePlotGroup(auto_refresh=False, category='Preference Maps', color_channel='None', desired_maximum_plot_height=0, doc='Measure preference for sine grating orientation using bimodal von Mises fit.', enforce_minimum_plot_height=True, filterfn=<function alwaystrue at 0x2b07ab86fb90>, integer_scaling=False, name='Bimodal Orientation Preference', normalize='None', plot_hooks=[], plot_immediately=False, pre_plot_hooks=[measure_sine_pref(durations=[1.0], frequencies=[2.4], inputs=[], max_speed=0.08333333333333333, measurement_prefix='', metafeature_fns=[<class 'featuremapper.metaparams.contrast2scale'>, <class 'featuremapper.metaparams.direction2translation'>], name='measure_sine_pref01381', num_direction=0, num_disparity=1, num_hue=1, num_ocularity=1, num_orientation=16, num_phase=18, num_speeds=4, offset=0.0, outputs=[], pattern_generator=SineGrating(bounds=BoundingBox(radius=0.5), frequency=2.4, group='Pattern', mask=None, mask_shape=None, name='SineGrating01383', offset=0.0, orientation=0.0, output_fns=[], phase=0.0, position=[0.0, 0.0], scale=1.0, size=1.0, x=0.0, xdensity=256, y=0.0, ydensity=256, z=None), pattern_response_fn=pattern_response(apply_output_fns=True, durations=[1.0], inputs={}, install_sheetview=False, measurement_prefix='', name='pattern_response01311', overwrite_previous=False, plastic=False, progress_bar=True, restore_events=True, restore_state=True, return_responses=True), preference_fn=DSF_BimodalVonMisesFit(name='DSF_BimodalVonMisesFit01380', selectivity_scale=(0.0, 1.0), value_scale=(0.0, 1.0), worst_fit=0.5), preference_lookup_fn=<function get_feature_preference at 0x2b07a8f600c8>, scale=0.3, static_parameters=['scale', 'offset'], subplot='Orientation')], prerequisites=[], sheet_coords=False)), ('Two Orientation Preferences', TemplatePlotGroup(auto_refresh=False, category='Preference Maps', color_channel='None', desired_maximum_plot_height=0, doc='Display the two most preferred orientations for each units, using bimodal von Mises fit.', enforce_minimum_plot_height=True, filterfn=<function alwaystrue at 0x2b07ab86fb90>, integer_scaling=False, name='Two Orientation Preferences', normalize='None', plot_hooks=[], plot_immediately=False, pre_plot_hooks=[measure_sine_pref(durations=[1.0], frequencies=[2.4], inputs=[], max_speed=0.08333333333333333, measurement_prefix='', metafeature_fns=[<class 'featuremapper.metaparams.contrast2scale'>, <class 'featuremapper.metaparams.direction2translation'>], name='measure_sine_pref01389', num_direction=0, num_disparity=1, num_hue=1, num_ocularity=1, num_orientation=16, num_phase=18, num_speeds=4, offset=0.0, outputs=[], pattern_generator=SineGrating(bounds=BoundingBox(radius=0.5), frequency=2.4, group='Pattern', mask=None, mask_shape=None, name='SineGrating01391', offset=0.0, orientation=0.0, output_fns=[], phase=0.0, position=[0.0, 0.0], scale=1.0, size=1.0, x=0.0, xdensity=256, y=0.0, ydensity=256, z=None), pattern_response_fn=pattern_response(apply_output_fns=True, durations=[1.0], inputs={}, install_sheetview=False, measurement_prefix='', name='pattern_response01311', overwrite_previous=False, plastic=False, progress_bar=True, restore_events=True, restore_state=True, return_responses=True), preference_fn=DSF_BimodalVonMisesFit(name='DSF_BimodalVonMisesFit01388', selectivity_scale=(0.0, 1.0), value_scale=(0.0, 1.0), worst_fit=0.5), preference_lookup_fn=<function get_feature_preference at 0x2b07a8f600c8>, scale=0.3, static_parameters=['scale', 'offset'], subplot='Orientation')], prerequisites=[], sheet_coords=False)), ('Spatial Frequency Preference', TemplatePlotGroup(auto_refresh=False, category='Preference Maps', color_channel='None', desired_maximum_plot_height=0, doc='Measure preference for sine grating orientation and frequency.', enforce_minimum_plot_height=True, filterfn=<function alwaystrue at 0x2b07ab86fb90>, integer_scaling=False, name='Spatial Frequency Preference', normalize='None', plot_hooks=[], plot_immediately=False, pre_plot_hooks=[measure_sine_pref(durations=[1.0], frequencies=[2.4], inputs=[], max_speed=0.08333333333333333, measurement_prefix='', metafeature_fns=[<class 'featuremapper.metaparams.contrast2scale'>, <class 'featuremapper.metaparams.direction2translation'>], name='measure_sine_pref01396', num_direction=0, num_disparity=1, num_hue=1, num_ocularity=1, num_orientation=4, num_phase=18, num_speeds=4, offset=0.0, outputs=[], pattern_generator=SineGrating(bounds=BoundingBox(radius=0.5), frequency=2.4, group='Pattern', mask=None, mask_shape=None, name='SineGrating01398', offset=0.0, orientation=0.0, output_fns=[], phase=0.0, position=[0.0, 0.0], scale=1.0, size=1.0, x=0.0, xdensity=256, y=0.0, ydensity=256, z=None), pattern_response_fn=pattern_response(apply_output_fns=True, durations=[1.0], inputs={}, install_sheetview=False, measurement_prefix='', name='pattern_response01311', overwrite_previous=False, plastic=False, progress_bar=True, restore_events=True, restore_state=True, return_responses=True), preference_fn=DSF_WeightedAverage(name='DSF_WeightedAverage01397', selectivity_scale=(0.0, 1.0), value_scale=(0.0, 1.0)), preference_lookup_fn=<function get_feature_preference at 0x2b07a8f600c8>, scale=0.3, static_parameters=['scale', 'offset'], subplot='Orientation')], prerequisites=[], sheet_coords=False)), ('Ocular Preference', TemplatePlotGroup(auto_refresh=False, category='Preference Maps', color_channel='None', desired_maximum_plot_height=0, doc='Measure preference for sine gratings between two eyes.', enforce_minimum_plot_height=True, filterfn=<function alwaystrue at 0x2b07ab86fb90>, integer_scaling=False, name='Ocular Preference', normalize='None', plot_hooks=[], plot_immediately=False, pre_plot_hooks=[measure_od_pref(durations=[1.0], frequencies=[2.4], inputs=[], measurement_prefix='', metafeature_fns=[<class 'featuremapper.metaparams.contrast2scale'>, <class 'featuremapper.metaparams.ocular2leftrightscale'>], name='measure_od_pref01401', num_orientation=4, num_phase=18, offset=0.0, outputs=[], pattern_generator=SineGrating(bounds=BoundingBox(radius=0.5), frequency=2.4, group='Pattern', mask=None, mask_shape=None, name='SineGrating01403', offset=0.0, orientation=0.0, output_fns=[], phase=0.0, position=[0.0, 0.0], scale=1.0, size=1.0, x=0.0, xdensity=256, y=0.0, ydensity=256, z=None), pattern_response_fn=pattern_response(apply_output_fns=True, durations=[1.0], inputs={}, install_sheetview=False, measurement_prefix='', name='pattern_response01311', overwrite_previous=False, plastic=False, progress_bar=True, restore_events=True, restore_state=True, return_responses=True), preference_fn=DSF_WeightedAverage(name='DSF_WeightedAverage01402', selectivity_scale=(0.0, 1.0), value_scale=(0.0, 1.0)), preference_lookup_fn=<function get_feature_preference at 0x2b07a8f600c8>, scale=0.3, static_parameters=['scale', 'offset'], subplot='')], prerequisites=[], sheet_coords=False)), ('PhaseDisparity Preference', TemplatePlotGroup(auto_refresh=False, category='Preference Maps', color_channel='None', desired_maximum_plot_height=0, doc='\n Measure preference for sine gratings at a specific orentation differing in phase\n between two input sheets.', enforce_minimum_plot_height=True, filterfn=<function alwaystrue at 0x2b07ab86fb90>, integer_scaling=False, name='PhaseDisparity Preference', normalize='Individually', plot_hooks=[], plot_immediately=False, pre_plot_hooks=[measure_phasedisparity(durations=[1.0], frequencies=[2.4], inputs=[], measurement_prefix='', metafeature_fns=[<class 'featuremapper.metaparams.contrast2scale'>, <class 'featuremapper.metaparams.phasedisparity2leftrightphase'>], name='measure_phasedisparity01406', num_disparity=12, num_orientation=4, num_phase=18, offset=0.0, orientation=1.5707963267948966, outputs=[], pattern_generator=SineGrating(bounds=BoundingBox(radius=0.5), frequency=2.4, group='Pattern', mask=None, mask_shape=None, name='SineGrating01408', offset=0.0, orientation=0.0, output_fns=[], phase=0.0, position=[0.0, 0.0], scale=1.0, size=1.0, x=0.0, xdensity=256, y=0.0, ydensity=256, z=None), pattern_response_fn=pattern_response(apply_output_fns=True, durations=[1.0], inputs={}, install_sheetview=False, measurement_prefix='', name='pattern_response01311', overwrite_previous=False, plastic=False, progress_bar=True, restore_events=True, restore_state=True, return_responses=True), preference_fn=DSF_WeightedAverage(name='DSF_WeightedAverage01407', selectivity_scale=(0.0, 1.0), value_scale=(0.0, 1.0)), preference_lookup_fn=<function get_feature_preference at 0x2b07a8f600c8>, scale=0.3, static_parameters=['orientation', 'scale', 'offset'], subplot='')], prerequisites=[], sheet_coords=False)), ('Direction Preference', TemplatePlotGroup(auto_refresh=False, category='Preference Maps', color_channel='None', desired_maximum_plot_height=0, doc='Measure preference for sine grating movement direction.', enforce_minimum_plot_height=True, filterfn=<function alwaystrue at 0x2b07ab86fb90>, integer_scaling=False, name='Direction Preference', normalize='None', plot_hooks=[], plot_immediately=False, pre_plot_hooks=[measure_dr_pref(durations=[1.0], frequencies=[2.4], inputs=[], max_speed=0.08333333333333333, measurement_prefix='', metafeature_fns=[<class 'featuremapper.metaparams.contrast2scale'>, <class 'featuremapper.metaparams.direction2translation'>], name='measure_dr_pref01413', num_direction=6, num_orientation=4, num_phase=12, num_speeds=4, offset=0.0, outputs=[], pattern_generator=SineGrating(bounds=BoundingBox(radius=0.5), frequency=2.4, group='Pattern', mask=None, mask_shape=None, name='SineGrating01415', offset=0.0, orientation=0.0, output_fns=[], phase=0.0, position=[0.0, 0.0], scale=1.0, size=1.0, x=0.0, xdensity=256, y=0.0, ydensity=256, z=None), pattern_response_fn=pattern_response(apply_output_fns=True, durations=[1.0], inputs={}, install_sheetview=False, measurement_prefix='', name='pattern_response01311', overwrite_previous=False, plastic=False, progress_bar=True, restore_events=True, restore_state=True, return_responses=True), preference_fn=DSF_WeightedAverage(name='DSF_WeightedAverage01414', selectivity_scale=(0.0, 1.0), value_scale=(0.0, 1.0)), preference_lookup_fn=<function get_feature_preference at 0x2b07a8f600c8>, scale=0.3, static_parameters=['scale', 'offset'], subplot='Direction')], prerequisites=[], sheet_coords=False)), ('Hue Preference', TemplatePlotGroup(auto_refresh=False, category='Preference Maps', color_channel='None', desired_maximum_plot_height=0, doc='Measure preference for colors.', enforce_minimum_plot_height=True, filterfn=<function alwaystrue at 0x2b07ab86fb90>, integer_scaling=False, name='Hue Preference', normalize='Individually', plot_hooks=[], plot_immediately=False, pre_plot_hooks=[measure_hue_pref(durations=[1.0], frequencies=[2.4], inputs=[], measurement_prefix='', metafeature_fns=[<class 'featuremapper.metaparams.contrast2scale'>, <class 'featuremapper.metaparams.hue2rgbscale'>], name='measure_hue_pref01420', num_hue=8, num_orientation=4, num_phase=12, offset=0.0, outputs=[], pattern_generator=SineGrating(bounds=BoundingBox(radius=0.5), frequency=2.4, group='Pattern', mask=None, mask_shape=None, name='SineGrating01422', offset=0.0, orientation=0.0, output_fns=[], phase=0.0, position=[0.0, 0.0], scale=1.0, size=1.0, x=0.0, xdensity=256, y=0.0, ydensity=256, z=None), pattern_response_fn=pattern_response(apply_output_fns=True, durations=[1.0], inputs={}, install_sheetview=False, measurement_prefix='', name='pattern_response01311', overwrite_previous=False, plastic=False, progress_bar=True, restore_events=True, restore_state=True, return_responses=True), preference_fn=DSF_WeightedAverage(name='DSF_WeightedAverage01421', selectivity_scale=(0.0, 1.0), value_scale=(0.0, 1.0)), preference_lookup_fn=<function get_feature_preference at 0x2b07a8f600c8>, scale=0.3, static_parameters=[], subplot='Hue')], prerequisites=[], sheet_coords=False)), ('Second Orientation Preference', TemplatePlotGroup(auto_refresh=False, category='Preference Maps', color_channel='None', desired_maximum_plot_height=0, doc='Measure the second preference for sine grating orientation.', enforce_minimum_plot_height=True, filterfn=<function alwaystrue at 0x2b07ab86fb90>, integer_scaling=False, name='Second Orientation Preference', normalize='None', plot_hooks=[], plot_immediately=False, pre_plot_hooks=[measure_second_or_pref(durations=[1.0], frequencies=[2.4], inputs=[], measurement_prefix='', metafeature_fns=[<class 'featuremapper.metaparams.contrast2scale'>], name='measure_second_or_pref01425', num_orientation=16, num_phase=18, offset=0.0, outputs=[], pattern_generator=SineGrating(bounds=BoundingBox(radius=0.5), frequency=2.4, group='Pattern', mask=None, mask_shape=None, name='SineGrating01427', offset=0.0, orientation=0.0, output_fns=[], phase=0.0, position=[0.0, 0.0], scale=1.0, size=1.0, x=0.0, xdensity=256, y=0.0, ydensity=256, z=None), pattern_response_fn=pattern_response(apply_output_fns=True, durations=[1.0], inputs={}, install_sheetview=False, measurement_prefix='', name='pattern_response01311', overwrite_previous=False, plastic=False, progress_bar=True, restore_events=True, restore_state=True, return_responses=True), preference_fn=DSF_WeightedAverage(name='DSF_WeightedAverage01426', selectivity_scale=(0.0, 1.0), value_scale=(0.0, 1.0)), preference_lookup_fn=<function get_feature_preference at 0x2b07a8f600c8>, scale=0.3, static_parameters=['scale', 'offset'], subplot='Second Orientation', true_peak=False)], prerequisites=[], sheet_coords=False)), ('Second Peak Orientation Preference', TemplatePlotGroup(auto_refresh=False, category='Preference Maps', color_channel='None', desired_maximum_plot_height=0, doc='Measure the second peak preference for sine grating orientation.', enforce_minimum_plot_height=True, filterfn=<function alwaystrue at 0x2b07ab86fb90>, integer_scaling=False, name='Second Peak Orientation Preference', normalize='None', plot_hooks=[], plot_immediately=False, pre_plot_hooks=[measure_second_or_pref(durations=[1.0], frequencies=[2.4], inputs=[], measurement_prefix='', metafeature_fns=[<class 'featuremapper.metaparams.contrast2scale'>], name='measure_second_or_pref01432', num_orientation=16, num_phase=18, offset=0.0, outputs=[], pattern_generator=SineGrating(bounds=BoundingBox(radius=0.5), frequency=2.4, group='Pattern', mask=None, mask_shape=None, name='SineGrating01434', offset=0.0, orientation=0.0, output_fns=[], phase=0.0, position=[0.0, 0.0], scale=1.0, size=1.0, x=0.0, xdensity=256, y=0.0, ydensity=256, z=None), pattern_response_fn=pattern_response(apply_output_fns=True, durations=[1.0], inputs={}, install_sheetview=False, measurement_prefix='', name='pattern_response01311', overwrite_previous=False, plastic=False, progress_bar=True, restore_events=True, restore_state=True, return_responses=True), preference_fn=DSF_WeightedAverage(name='DSF_WeightedAverage01433', selectivity_scale=(0.0, 1.0), value_scale=(0.0, 1.0)), preference_lookup_fn=<function get_feature_preference at 0x2b07a8f600c8>, scale=0.3, static_parameters=['scale', 'offset'], subplot='Second Orientation', true_peak=True)], prerequisites=[], sheet_coords=False)), ('Two Peaks Orientation Preferences', TemplatePlotGroup(auto_refresh=False, category='Preference Maps', color_channel='None', desired_maximum_plot_height=0, doc='Display the two most preferred orientations for\n all units with a multimodal orientation preference\n distribution.', enforce_minimum_plot_height=True, filterfn=<function alwaystrue at 0x2b07ab86fb90>, integer_scaling=False, name='Two Peaks Orientation Preferences', normalize='None', plot_hooks=[], plot_immediately=False, pre_plot_hooks=[measure_second_or_pref(durations=[1.0], frequencies=[2.4], inputs=[], measurement_prefix='', metafeature_fns=[<class 'featuremapper.metaparams.contrast2scale'>], name='measure_second_or_pref01439', num_orientation=16, num_phase=18, offset=0.0, outputs=[], pattern_generator=SineGrating(bounds=BoundingBox(radius=0.5), frequency=2.4, group='Pattern', mask=None, mask_shape=None, name='SineGrating01441', offset=0.0, orientation=0.0, output_fns=[], phase=0.0, position=[0.0, 0.0], scale=1.0, size=1.0, x=0.0, xdensity=256, y=0.0, ydensity=256, z=None), pattern_response_fn=pattern_response(apply_output_fns=True, durations=[1.0], inputs={}, install_sheetview=False, measurement_prefix='', name='pattern_response01311', overwrite_previous=False, plastic=False, progress_bar=True, restore_events=True, restore_state=True, return_responses=True), preference_fn=DSF_WeightedAverage(name='DSF_WeightedAverage01440', selectivity_scale=(0.0, 1.0), value_scale=(0.0, 1.0)), preference_lookup_fn=<function get_feature_preference at 0x2b07a8f600c8>, scale=0.3, static_parameters=['scale', 'offset'], subplot='Second Orientation', true_peak=True)], prerequisites=[], sheet_coords=False)), ('Corner OR Preference', TemplatePlotGroup(auto_refresh=False, category='Preference Maps', color_channel='None', desired_maximum_plot_height=0, doc='Measure orientation preference for corner shape (or other complex stimuli that cannot be represented as fullfield patterns).', enforce_minimum_plot_height=True, filterfn=<function alwaystrue at 0x2b07ab86fb90>, integer_scaling=False, name='Corner OR Preference', normalize='Individually', plot_hooks=[], plot_immediately=False, pre_plot_hooks=[measure_corner_or_pref(divisions=11, durations=[1.0], inputs=[], measurement_prefix='', metafeature_fns=[<class 'featuremapper.metaparams.contrast2scale'>], name='measure_corner_or_pref01447', num_orientation=4, offset=0.0, outputs=[], pattern_generator=Composite(bounds=BoundingBox(radius=0.5), generators=[Gaussian(aspect_ratio=7, bounds=BoundingBox(radius=0.5), group='Pattern', mask=None, mask_shape=None, name='Gaussian00977', offset=0.0, orientation=0, output_fns=[], position=[0.3, 0.0], scale=1.0, size=0.06, x=0.3, xdensity=256, y=0.0, ydensity=256, z=None), Gaussian(aspect_ratio=7, bounds=BoundingBox(radius=0.5), group='Pattern', mask=None, mask_shape=None, name='Gaussian00978', offset=0.0, orientation=1.5707963267948966, output_fns=[], position=[0.0, 0.3], scale=1.0, size=0.06, x=0.0, xdensity=256, y=0.3, ydensity=256, z=None)], group='Pattern', mask=None, mask_shape=None, name='Composite01449', offset=0.0, operator=<ufunc 'maximum'>, orientation=0.0, output_fns=[], position=[0.0, 0.0], scale=1.0, size=1.0, x=0.0, xdensity=256, y=0.0, ydensity=256, z=None), pattern_response_fn=pattern_response(apply_output_fns=True, durations=[1.0], inputs={}, install_sheetview=False, measurement_prefix='', name='pattern_response01311', overwrite_previous=False, plastic=False, progress_bar=True, restore_events=True, restore_state=True, return_responses=True), preference_fn=DSF_WeightedAverage(name='DSF_WeightedAverage01446', selectivity_scale=(0.0, 1.0), value_scale=(0.0, 1.0)), preference_lookup_fn=<function get_feature_preference at 0x2b07a8f600c8>, scale=1.0, size=0.5, static_parameters=['scale', 'offset'], subplot='', x_range=(-1.2, 1.2), y_range=(-1.2, 1.2))], prerequisites=[], sheet_coords=False)), ('Corner Angle Preference', TemplatePlotGroup(auto_refresh=False, category='Preference Maps', color_channel='None', desired_maximum_plot_height=0, doc='Measure preference for angles in corner shapes', enforce_minimum_plot_height=True, filterfn=<function alwaystrue at 0x2b07ab86fb90>, integer_scaling=False, name='Corner Angle Preference', normalize='Individually', plot_hooks=[], plot_immediately=False, pre_plot_hooks=[measure_corner_angle_pref(angle_0=0.7853981633974483, angle_1=2.356194490192345, divisions=7, durations=[1.0], inputs=[], measurement_prefix='', metafeature_fns=[<class 'featuremapper.metaparams.contrast2scale'>], name='measure_corner_angle_pref01454', num_angle=4, num_or=4, offset=0.0, outputs=[], pattern_generator=GaussiansCorner(angle=1.5707963267948966, aspect_ratio=4.0, bounds=BoundingBox(radius=0.5), cross=0.85, group='Pattern', mask=None, mask_shape=None, name='GaussiansCorner01456', offset=0.0, orientation=0.0, output_fns=[], position=[-0.15, -0.15], scale=1.0, size=0.5, x=-0.15, xdensity=256, y=-0.15, ydensity=256, z=None), pattern_response_fn=pattern_response(apply_output_fns=True, durations=[1.0], inputs={}, install_sheetview=False, measurement_prefix='', name='pattern_response01311', overwrite_previous=False, plastic=False, progress_bar=True, restore_events=True, restore_state=True, return_responses=True), positions=7, preference_fn=DSF_MaxValue(name='DSF_MaxValue01455', selectivity_scale=(0.0, 1.0), value_scale=(0.0, 1.0)), preference_lookup_fn=<function get_feature_preference at 0x2b07a8f600c8>, scale=1.0, size=0.2, static_parameters=['size', 'scale', 'offset'], subplot='', x_range=(-1.0, 1.0), y_range=(-1.0, 1.0))], prerequisites=[], sheet_coords=False)), ('Position Preference', TemplatePlotGroup(auto_refresh=False, category='Preference Maps', color_channel='None', desired_maximum_plot_height=0, doc='Measure preference for the X and Y position of a Gaussian.', enforce_minimum_plot_height=True, filterfn=<function alwaystrue at 0x2b07ab86fb90>, integer_scaling=False, name='Position Preference', normalize='Individually', plot_hooks=[topographic_grid(axis=[-0.5, 0.5, -0.5, 0.5], display_window=True, file_dpi=100.0, file_format='png', filename=None, filename_suffix='', name='topographic_grid01463', skip=1, title=None, x=None, xsheet_view_name='XPreference', y=None, ysheet_view_name='YPreference')], plot_immediately=False, pre_plot_hooks=[measure_position_pref(divisions=7, durations=[1.0], inputs=[], measurement_prefix='', metafeature_fns=[<class 'featuremapper.metaparams.contrast2scale'>], name='measure_position_pref01460', offset=0.0, outputs=[], pattern_generator=Gaussian(aspect_ratio=1.0, bounds=BoundingBox(radius=0.5), group='Pattern', mask=None, mask_shape=None, name='Gaussian01462', offset=0.0, orientation=0.0, output_fns=[], position=[0.0, 0.0], scale=1.0, size=0.155, x=0.0, xdensity=256, y=0.0, ydensity=256, z=None), pattern_response_fn=pattern_response(apply_output_fns=True, durations=[1.0], inputs={}, install_sheetview=False, measurement_prefix='', name='pattern_response01311', overwrite_previous=False, plastic=False, progress_bar=True, restore_events=True, restore_state=True, return_responses=True), preference_fn=DSF_WeightedAverage(name='DSF_WeightedAverage01459', selectivity_scale=(0.0, 17.0), value_scale=(0.0, 1.0)), preference_lookup_fn=<function get_feature_preference at 0x2b07a8f600c8>, scale=0.3, size=0.5, static_parameters=['scale', 'offset', 'size'], subplot='', x_range=(-0.5, 0.5), y_range=(-0.5, 0.5))], prerequisites=[], sheet_coords=False)), ('Orientation Tuning Fullfield', FeatureCurvePlotGroup(auto_refresh=False, category='Tuning Curves', color_channel='None', desired_maximum_plot_height=0, doc='\n Plot orientation tuning curves for a specific unit, measured using full-field sine gratings.\n Although the data takes a long time to collect, once it is ready the plots\n are available immediately for any unit.', enforce_minimum_plot_height=True, filterfn=<function alwaystrue at 0x2b07ab86fb90>, integer_scaling=False, name='Orientation Tuning Fullfield', normalize='None', plot_hooks=[tuning_curve(center=True, coord=(0, 0), coords=[(0, 0)], display_window=True, file_dpi=100.0, file_format='png', filename=None, filename_suffix='', group_by=['Contrast'], legend=True, name='tuning_curve01469', relative_labels=False, sheet=None, title=None, x_axis='orientation')], plot_immediately=False, pre_plot_hooks=[measure_or_tuning_fullfield(contrasts=[30, 60, 80, 90], coords=None, durations=[1.0], frequencies=[2.4], inputs=[], measurement_prefix='', metafeature_fns=[<class 'featuremapper.metaparams.contrast2scale'>], name='measure_or_tuning_fullfield01466', num_orientation=12, num_phase=18, offset=0.0, outputs=[], pattern_generator=SineGrating(bounds=BoundingBox(radius=0.5), frequency=2.4, group='Pattern', mask=None, mask_shape=None, name='SineGrating01468', offset=0.0, orientation=0.0, output_fns=[], phase=0.0, position=[0.0, 0.0], scale=1.0, size=1.0, x=0.0, xdensity=256, y=0.0, ydensity=256, z=None), pattern_response_fn=pattern_response(apply_output_fns=True, durations=[1.0], inputs={}, install_sheetview=False, measurement_prefix='', name='pattern_response01311', overwrite_previous=False, plastic=False, progress_bar=True, restore_events=True, restore_state=True, return_responses=True), preference_fn=DSF_WeightedAverage(name='DSF_WeightedAverage01467', selectivity_scale=(0.0, 1.0), value_scale=(0.0, 1.0)), preference_lookup_fn=<function get_feature_preference at 0x2b07a8f600c8>, scale=0.3, static_parameters=[], subplot='', x_axis='orientation')], prerequisites=[], sheet=None, sheet_coords=False, x=0.0, y=0.0)), ('Orientation Tuning', FeatureCurvePlotGroup(auto_refresh=False, category='Tuning Curves', color_channel='None', desired_maximum_plot_height=0, doc='\n Measure orientation tuning for a specific unit at different contrasts,\n using a pattern chosen to match the preferences of that unit.', enforce_minimum_plot_height=True, filterfn=<function alwaystrue at 0x2b07ab86fb90>, integer_scaling=False, name='Orientation Tuning', normalize='None', plot_hooks=[tuning_curve(center=True, coord=(0, 0), coords=[(0, 0)], display_window=True, file_dpi=100.0, file_format='png', filename=None, filename_suffix='', group_by=['Contrast'], legend=True, name='tuning_curve01475', relative_labels=False, sheet=None, title=None, x_axis='orientation')], plot_immediately=False, pre_plot_hooks=[measure_or_tuning(contrasts=[30, 60, 80, 90], coords=[(0, 0)], durations=[1.0], frequencies=[2.4], inputs=[], measurement_prefix='', metafeature_fns=[contrast2scale(contrast_parameter='weber_contrast', name='contrast2scale00972')], name='measure_or_tuning01472', num_orientation=12, num_phase=18, offset=0.0, outputs=[], pattern_generator=SineGrating(bounds=BoundingBox(radius=0.5), frequency=2.4, group='Pattern', mask=None, mask_shape=Disk(aspect_ratio=1.0, bounds=BoundingBox(radius=0.5), group='Pattern', mask=None, mask_shape=None, name='Disk00970', offset=0.0, orientation=0.0, output_fns=[], position=[0.0, 0.0], scale=1.0, size=1.0, smoothing=0.0, x=0.0, xdensity=256, y=0.0, ydensity=256, z=None), name='SineGrating01474', offset=0.0, orientation=0.0, output_fns=[], phase=0.0, position=[0.0, 0.0], scale=1.0, size=1.0, x=0.0, xdensity=256, y=0.0, ydensity=256, z=None), pattern_response_fn=pattern_response(apply_output_fns=True, durations=[1.0], inputs={}, install_sheetview=False, measurement_prefix='', name='pattern_response01311', overwrite_previous=False, plastic=False, progress_bar=True, restore_events=True, restore_state=True, return_responses=True), preference_fn=DSF_WeightedAverage(name='DSF_WeightedAverage01473', selectivity_scale=(0.0, 1.0), value_scale=(0.0, 1.0)), preference_lookup_fn=<function get_feature_preference at 0x2b07a8f600c8>, scale=0.3, size=0.5, static_parameters=['size', 'x', 'y'], subplot='', x_axis='orientation')], prerequisites=['XPreference'], sheet=None, sheet_coords=False, x=0.0, y=0.0)), ('Size Tuning', FeatureCurvePlotGroup(auto_refresh=False, category='Tuning Curves', color_channel='None', desired_maximum_plot_height=0, doc='Measure the size preference for a specific unit.', enforce_minimum_plot_height=True, filterfn=<function alwaystrue at 0x2b07ab86fb90>, integer_scaling=False, name='Size Tuning', normalize='None', plot_hooks=[tuning_curve(center=True, coord=(0, 0), coords=[(0, 0)], display_window=True, file_dpi=100.0, file_format='png', filename=None, filename_suffix='', group_by=['Contrast'], legend=True, name='tuning_curve01481', relative_labels=False, sheet=None, title=None, x_axis='size')], plot_immediately=False, pre_plot_hooks=[measure_size_response(contrasts=[30, 60, 80, 90], coords=[(0, 0)], durations=[1.0], frequencies=[2.4], inputs=[], max_size=1.0, measurement_prefix='', metafeature_fns=[contrast2scale(contrast_parameter='weber_contrast', name='contrast2scale00972')], name='measure_size_response01478', num_orientation=12, num_phase=18, num_sizes=11, offset=0.0, outputs=[], pattern_generator=SineGrating(bounds=BoundingBox(radius=0.5), frequency=2.4, group='Pattern', mask=None, mask_shape=Disk(aspect_ratio=1.0, bounds=BoundingBox(radius=0.5), group='Pattern', mask=None, mask_shape=None, name='Disk00970', offset=0.0, orientation=0.0, output_fns=[], position=[0.0, 0.0], scale=1.0, size=1.0, smoothing=0.0, x=0.0, xdensity=256, y=0.0, ydensity=256, z=None), name='SineGrating01480', offset=0.0, orientation=0.0, output_fns=[], phase=0.0, position=[0.0, 0.0], scale=1.0, size=1.0, x=0.0, xdensity=256, y=0.0, ydensity=256, z=None), pattern_response_fn=pattern_response(apply_output_fns=True, durations=[1.0], inputs={}, install_sheetview=False, measurement_prefix='', name='pattern_response01311', overwrite_previous=False, plastic=False, progress_bar=True, restore_events=True, restore_state=True, return_responses=True), preference_fn=DSF_WeightedAverage(name='DSF_WeightedAverage01479', selectivity_scale=(0.0, 1.0), value_scale=(0.0, 1.0)), preference_lookup_fn=<function get_feature_preference at 0x2b07a8f600c8>, scale=0.3, size=0.5, static_parameters=['orientation', 'x', 'y'], subplot='', x_axis='size')], prerequisites=['OrientationPreference', 'XPreference'], sheet=None, sheet_coords=False, x=0.0, y=0.0)), ('Contrast Response', FeatureCurvePlotGroup(auto_refresh=False, category='Tuning Curves', color_channel='None', desired_maximum_plot_height=0, doc='Measure the contrast response function for a specific unit.', enforce_minimum_plot_height=True, filterfn=<function alwaystrue at 0x2b07ab86fb90>, integer_scaling=False, name='Contrast Response', normalize='None', plot_hooks=[tuning_curve(center=True, coord=(0, 0), coords=[(0, 0)], display_window=True, file_dpi=100.0, file_format='png', filename=None, filename_suffix='', group_by=['Contrast'], legend=True, name='tuning_curve01487', relative_labels=False, sheet=None, title=None, x_axis='contrast')], plot_immediately=False, pre_plot_hooks=[measure_contrast_response(contrasts=[10, 20, 30, 40, 50, 60, 70, 80, 90, 100], coords=[(0, 0)], durations=[1.0], frequencies=[2.4], inputs=[], measurement_prefix='', metafeature_fns=[contrast2scale(contrast_parameter='weber_contrast', name='contrast2scale00972')], name='measure_contrast_response01484', num_orientation=12, num_phase=18, offset=0.0, outputs=[], pattern_generator=SineGrating(bounds=BoundingBox(radius=0.5), frequency=2.4, group='Pattern', mask=None, mask_shape=Disk(aspect_ratio=1.0, bounds=BoundingBox(radius=0.5), group='Pattern', mask=None, mask_shape=None, name='Disk00970', offset=0.0, orientation=0.0, output_fns=[], position=[0.0, 0.0], scale=1.0, size=1.0, smoothing=0.0, x=0.0, xdensity=256, y=0.0, ydensity=256, z=None), name='SineGrating01486', offset=0.0, orientation=0.0, output_fns=[], phase=0.0, position=[0.0, 0.0], scale=1.0, size=1.0, x=0.0, xdensity=256, y=0.0, ydensity=256, z=None), pattern_response_fn=pattern_response(apply_output_fns=True, durations=[1.0], inputs={}, install_sheetview=False, measurement_prefix='', name='pattern_response01311', overwrite_previous=False, plastic=False, progress_bar=True, restore_events=True, restore_state=True, return_responses=True), preference_fn=DSF_WeightedAverage(name='DSF_WeightedAverage01485', selectivity_scale=(0.0, 1.0), value_scale=(0.0, 1.0)), preference_lookup_fn=<function get_feature_preference at 0x2b07a8f600c8>, relative_orientations=[0.0, 0.5235987755982988, 0.7853981633974483, 1.5707963267948966], scale=0.3, size=0.5, static_parameters=['size', 'x', 'y'], subplot='', x_axis='contrast')], prerequisites=['OrientationPreference', 'XPreference'], sheet=None, sheet_coords=False, x=0.0, y=0.0)), ('Frequency Tuning', FeatureCurvePlotGroup(auto_refresh=False, category='Tuning Curves', color_channel='None', desired_maximum_plot_height=0, doc='Measure the spatial frequency preference for a specific unit.', enforce_minimum_plot_height=True, filterfn=<function alwaystrue at 0x2b07ab86fb90>, integer_scaling=False, name='Frequency Tuning', normalize='None', plot_hooks=[tuning_curve(center=True, coord=(0, 0), coords=[(0, 0)], display_window=True, file_dpi=100.0, file_format='png', filename=None, filename_suffix='', group_by=['Contrast'], legend=True, name='tuning_curve01493', relative_labels=False, sheet=None, title=None, x_axis='frequency')], plot_immediately=False, pre_plot_hooks=[measure_frequency_response(contrasts=[30, 60, 80, 90], coords=[(0, 0)], durations=[1.0], frequencies=[2.4], inputs=[], max_freq=10.0, measurement_prefix='', metafeature_fns=[contrast2scale(contrast_parameter='weber_contrast', name='contrast2scale00972')], name='measure_frequency_response01490', num_freq=21, num_orientation=12, num_phase=18, offset=0.0, outputs=[], pattern_generator=SineGrating(bounds=BoundingBox(radius=0.5), frequency=2.4, group='Pattern', mask=None, mask_shape=Disk(aspect_ratio=1.0, bounds=BoundingBox(radius=0.5), group='Pattern', mask=None, mask_shape=None, name='Disk00970', offset=0.0, orientation=0.0, output_fns=[], position=[0.0, 0.0], scale=1.0, size=1.0, smoothing=0.0, x=0.0, xdensity=256, y=0.0, ydensity=256, z=None), name='SineGrating01492', offset=0.0, orientation=0.0, output_fns=[], phase=0.0, position=[0.0, 0.0], scale=1.0, size=1.0, x=0.0, xdensity=256, y=0.0, ydensity=256, z=None), pattern_response_fn=pattern_response(apply_output_fns=True, durations=[1.0], inputs={}, install_sheetview=False, measurement_prefix='', name='pattern_response01311', overwrite_previous=False, plastic=False, progress_bar=True, restore_events=True, restore_state=True, return_responses=True), preference_fn=DSF_WeightedAverage(name='DSF_WeightedAverage01491', selectivity_scale=(0.0, 1.0), value_scale=(0.0, 1.0)), preference_lookup_fn=<function get_feature_preference at 0x2b07a8f600c8>, scale=0.3, size=0.5, static_parameters=['orientation', 'x', 'y'], subplot='', x_axis='frequency')], prerequisites=['OrientationPreference', 'XPreference'], sheet=None, sheet_coords=False, x=0.0, y=0.0)), ('Orientation Contrast', FeatureCurvePlotGroup(auto_refresh=False, category='Tuning Curves', color_channel='None', desired_maximum_plot_height=0, doc='Measure the response of one unit to a center and surround sine grating disk.', enforce_minimum_plot_height=True, filterfn=<function alwaystrue at 0x2b07ab86fb90>, integer_scaling=False, name='Orientation Contrast', normalize='None', plot_hooks=[tuning_curve(center=False, coord=(0, 0), coords=[(0, 0)], display_window=True, file_dpi=100.0, file_format='png', filename=None, filename_suffix='', group_by=['Contrast'], legend=True, name='tuning_curve01499', relative_labels=True, sheet=None, title=None, x_axis='orientationsurround')], plot_immediately=False, pre_plot_hooks=[measure_orientation_contrast(contrastcenter=100, contrasts=[30, 60, 80, 90], contrastsurround=[30, 60, 80, 90], coords=[(0, 0)], durations=[1.0], frequencies=[2.4], inputs=[], measurement_prefix='', metafeature_fns=[contrast2centersurroundscale(contrast_parameter='weber_contrast', name='contrast2centersurroundscale00982')], name='measure_orientation_contrast01496', num_orientation=9, num_phase=18, offset=0.0, orientation_center=0.0, outputs=[], pattern_generator=OrientationContrast(aspect_ratio=1.0, bounds=BoundingBox(radius=0.5), frequency=2.4, group='Pattern', mask=None, mask_shape=None, name='OrientationContrast01498', offset=0.0, offsetcenter=0.0, offsetsurround=0.0, orientation=0.0, orientationcenter=0.0, orientationsurround=0.0, output_fns=[], phase=0.0, position=[0.0, 0.0], scale=1.0, scalecenter=1.0, scalesurround=1.0, size=0.5, sizecenter=0.5, sizesurround=1.0, smoothing=0.0, surround_orientation_relative=True, thickness=0.3, x=0.0, xdensity=256, y=0.0, ydensity=256, z=None), pattern_response_fn=pattern_response(apply_output_fns=True, durations=[1.0], inputs={}, install_sheetview=False, measurement_prefix='', name='pattern_response01311', overwrite_previous=False, plastic=False, progress_bar=True, restore_events=True, restore_state=True, return_responses=True), preference_fn=DSF_WeightedAverage(name='DSF_WeightedAverage01497', selectivity_scale=(0.0, 1.0), value_scale=(0.0, 1.0)), preference_lookup_fn=<function get_feature_preference at 0x2b07a8f600c8>, scale=0.3, size=0.5, sizecenter=0.5, sizesurround=1.0, static_parameters=['x', 'y', 'sizecenter', 'sizesurround', 'orientationcenter', 'thickness', 'contrastcenter'], subplot='', thickness=0.5, x_axis='orientationsurround')], prerequisites=['OrientationPreference', 'XPreference'], sheet=None, sheet_coords=False, x=0.0, y=0.0))])
Global repository of PlotGroups, to which users can add their own as needed.
- class topo.plotting.plotgroup.save_plotgroup(**params)[source]
Bases: param.parameterized.ParameterizedFunction
Convenience command for saving a set of plots to disk. Examples:
save_plotgroup(“Activity”) save_plotgroup(“Orientation Preference”) save_plotgroup(“Projection”,projection=topo.sim[‘V1’].projections(‘Afferent’))Some plotgroups accept optional parameters, which can be passed like projection above.
- param Dict saver_params (allow_None=False, constant=False, default={}, instantiate=True, is_instance=True, pickle_default_value=True, precedence=None, readonly=False)
- Optional parameters to pass to the underlying PlotFileSaver object.
- param Callable equivalence_fn (allow_None=False, constant=False, instantiate=False, pickle_default_value=True, precedence=None, readonly=False)
- Function to call on plotgroups p1,p2 to determine if calling pre_plot_hooks on one of them is sufficient to update both plots. Should return False unless the commands are exact equivalents, including all relevant parameters.
- param Boolean use_cached_results (allow_None=False, bounds=(0, 1), constant=False, default=False, instantiate=False, pickle_default_value=True, precedence=None, readonly=False)
- If True, will use the equivalence_fn to determine cases where the pre_plot_hooks for a plotgroup can safely be skipped, to avoid lengthy redundant computation. Should usually be False for safety, but can be enabled for e.g. batch mode runs using a related batch of plots.
- debug(msg, *args, **kw)
Print msg merged with args as a debugging statement.
See Python’s logging module for details of message formatting.
- defaults()
Return {parameter_name:parameter.default} for all non-constant Parameters.
Note that a Parameter for which instantiate==True has its default instantiated.
- static equivalence_fn(p1, p2)
Helper function for save_plotgroup.
Comparison operator for deciding whether make_plots(update==False) is safe for one plotgroup if the other has already been updated.
Treats plotgroups as the same if the specified list of attributes (if present) match in both plotgroups.
- force_new_dynamic_value = <functools.partial object at 0x2b07af1b0f18>
- get_param_values(onlychanged=False)
Return a list of name,value pairs for all Parameters of this object.
If onlychanged is True, will only return values that are not equal to the default value.
- get_value_generator = <functools.partial object at 0x2b07af1b0e10>
- inspect_value = <functools.partial object at 0x2b07af1b0fc8>
- instance = <functools.partial object at 0x2b07af1b0f70>
- message(msg, *args, **kw)
Print msg merged with args as a message.
See Python’s logging module for details of message formatting.
- classmethod params(parameter_name=None)
Return the Parameters of this class as the dictionary {name: parameter_object}
Includes Parameters from this class and its superclasses.
- pprint(imports=None, prefix='n ', unknown_value='<?>', qualify=False, separator='')
Same as Parameterized.pprint, except that X.classname(Y is replaced with X.classname.instance(Y
- classmethod print_param_defaults()
Print the default values of all cls’s Parameters.
- print_param_values()
Print the values of all this object’s Parameters.
- script_repr(imports=, []prefix=' ')
Same as Parameterized.script_repr, except that X.classname(Y is replaced with X.classname.instance(Y
- classmethod set_default(param_name, value)
Set the default value of param_name.
Equivalent to setting param_name on the class.
- set_dynamic_time_fn = <functools.partial object at 0x2b07af1b0db8>
- set_param = <functools.partial object at 0x2b07af1b0cb0>
- state_pop()
Restore the most recently saved state.
See state_push() for more details.
- state_push()
Save this instance’s state.
For Parameterized instances, this includes the state of dynamically generated values.
Subclasses that maintain short-term state should additionally save and restore that state using state_push() and state_pop().
Generally, this method is used by operations that need to test something without permanently altering the objects’ state.
- verbose(msg, *args, **kw)
Print msg merged with args as a verbose message.
See Python’s logging module for details of message formatting.
- warning(msg, *args, **kw)
Print msg merged with args as a warning, unless module variable warnings_as_exceptions is True, then raise an Exception containing the arguments.
See Python’s logging module for details of message formatting.